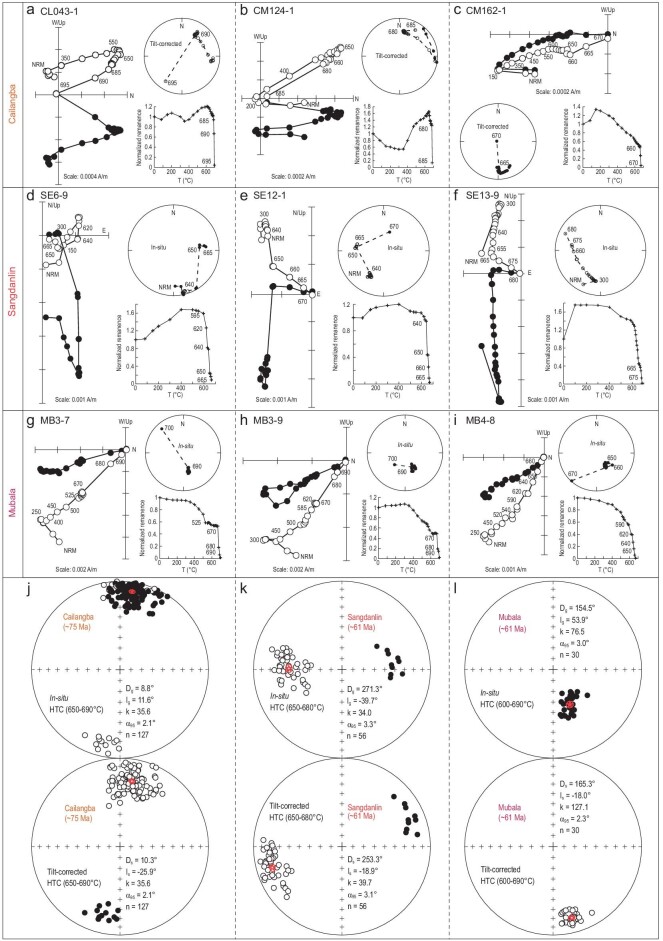
Figure 3.
Paleomagnetic results. (a−i) Representative orthogonal demagnetization diagrams in geographic (stratigraphic) coordinates with corresponding normalized natural remanent magnetization (NRM) vs. temperature plots and equal-area stereonets in the Cailangba (specimens CL043-1, CM124-1 and CM162-1), Sangdanlin (specimens SE6-9, SE12-1 and SE13-9) and Mubala (specimens MB3-7, MB3-9 and MB4-8) sections. (j−l) Equal-area projections of in situ (upper) and tilt-corrected (lower) paleomagnetic directions. (j) HTC directions of all specimens in the Cailangba section. (k) HTC directions of all specimens in the Sangdanlin section. (l) HTC directions of all specimens in the Mubala section. Red circles around the red stars in (j−l) denote the 95% confidence limit and mean directions. Solid and open symbols denote the lower and upper hemisphere projections, respectively.

