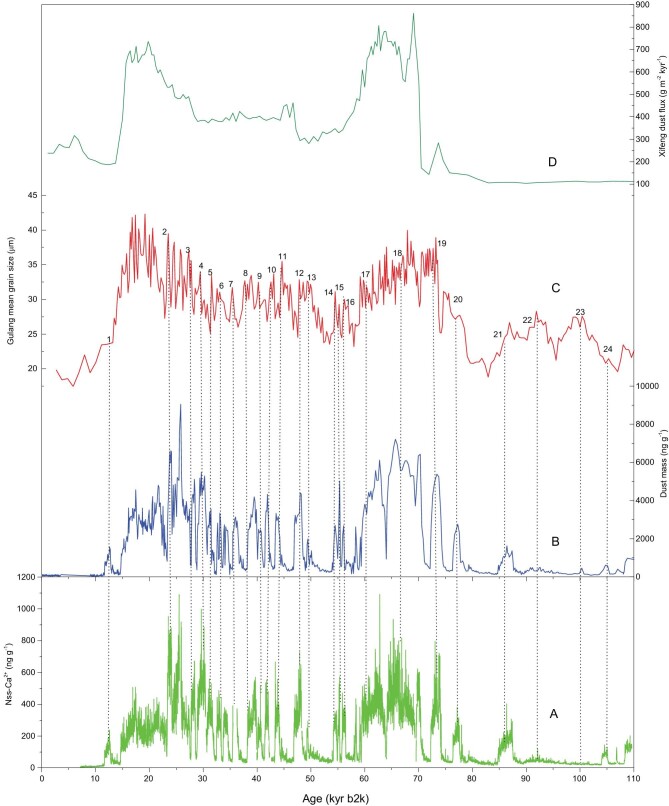
Figure 2.
Comparison of the concentrations of Nss-Ca2+ (A) [41], the dust mass (B) in the NEEM ice core from this study, the median grain size in the Gulang record (C) [39] and the Xifeng dust fluxes (D) [38]. The dotted lines show the correlation of 24 D-O cycles between the NEEM ice core and the Gulang loess.

