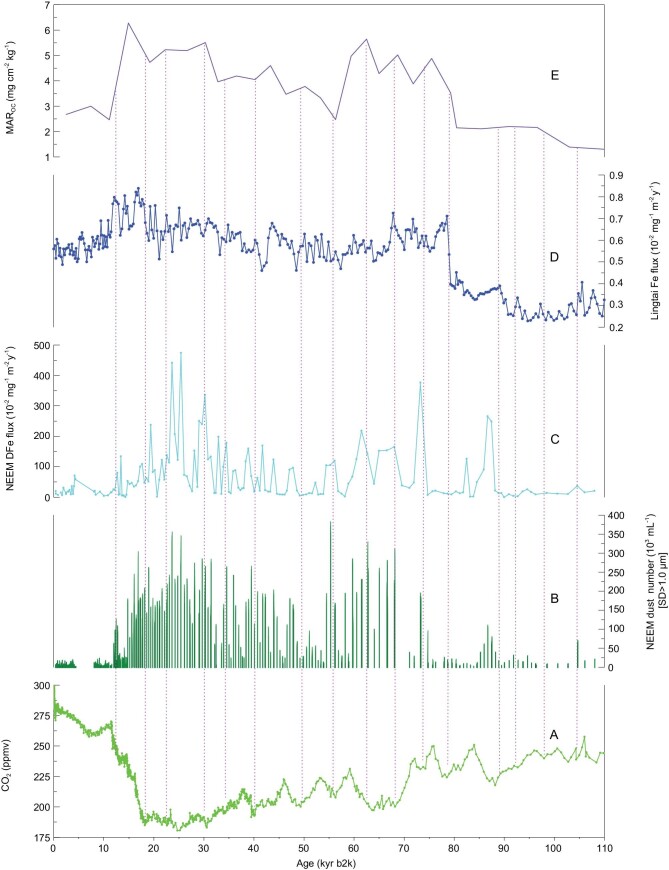
Figure 4.
DFe fluxes and dust-particle concentrations recorded in the NEEM ice core, Fe fluxes from the Lingtai and Xifeng loess profiles, paleoproductivity represented by the variations of MAROC in the H3571 core from the North Pacific Ocean and atmospheric CO2 recorded in Antarctica ice cores over 110 kyr BP. (A) CO2 concentration in the Antarctic ice cores from https://www.ncdc.noaa.gov/data-access/paleoclimatology-data; (B) the NEEM dust-particle concentration (this study); (C) the NEEM DFe flux (this study); (D) Fe flux in the Lingtai loess [42]; (E) H3571 MAROC [44]. Magenta dotted lines mark low CO2 concentrations, which coincide with high Fe fluxes.

