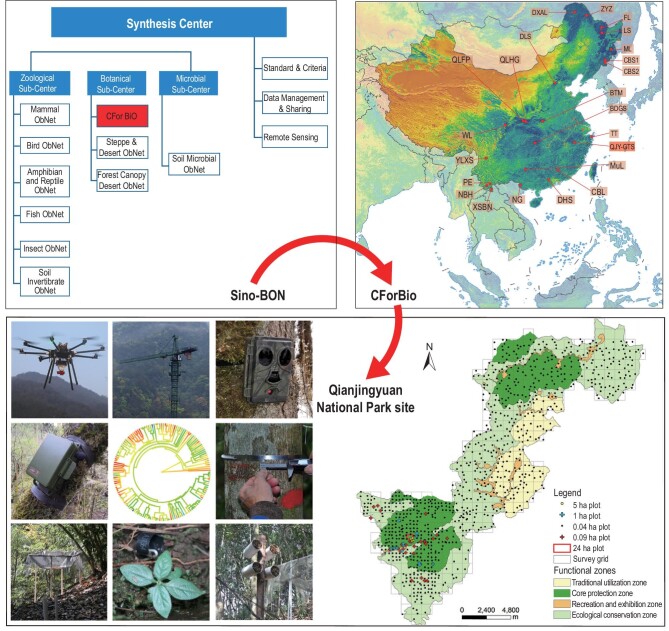
Figure 4.
An illustration of how Sino-BON is organized from sites (Qianjiangyuan National Park, GTS) to subnetwork (CForBio) and national-scale network (Sino-BON) for monitoring dynamics of species and ecosystems, and multiple trophic interactions through cooperation among the 10 subnetworks. Top left panel: structure of Sino-BON (Chinese Biodiversity Monitoring and Research Network) including a synthesis centre and zoological, botanical and microbial sub-centres. The Zoological sub-centre includes six subnetworks (ObNet): Mammal, Bird, Amphibian and Reptile, Fish, Insect and Soil Invertebrate. The Botanical sub-centre includes three subnetworks: CForBio (Chinese Forest Biodiversity Monitoring Network), Steppe and Desert, and Forest Canopy. The microbial sub-centre includes only the microbial subnetwork. Top right panel: 20 large forest dynamics plots along latitude in Eastern China. Bottom right panel: 1 km × 1 km grids in four zones of Qianjiangyuan National Park. Bottom left panel: biodiversity monitoring at the Park from top to bottom: drone for near-surface remote sensing, forest crane for canopy biodiversity, infrared-triggered camera for mammals and birds, automated acoustic recording device for songbirds, phylogeny of woody species with molecular data, dendrometer measuring the growth of trees, seed rain trap, seedling plot, insect nest trap. The map of China is from http://bzdt.ch.mnr.gov.cn/.

