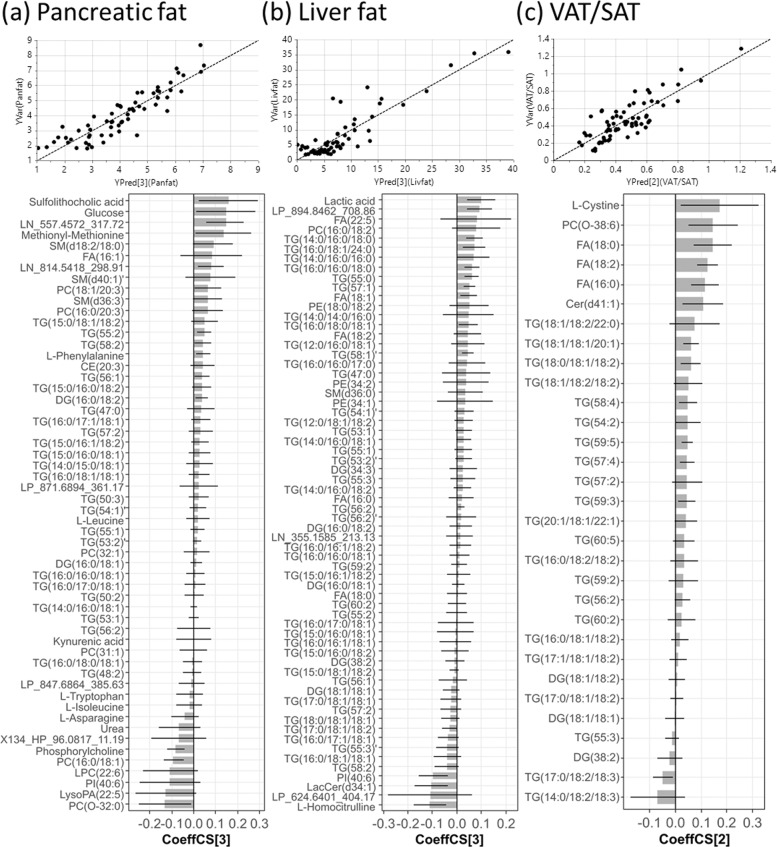
Fig. 1. Partial least squares (PLS) regression analysis of ectopic fat deposition.
Scatter plots of measured vs PLS-estimated value of (a) pancreatic fat, (b) liver fat and (c) VAT/SAT ratio, and bar plots showing the coeffCS (centred and scaled coefficient) with error bars indicating cross-validation confidence interval (95% CI) of variables in each corresponding PLS model used for estimation. The numbers in the bracket beside YPred and CoeffCS denotes the number of components in the PLS model.

