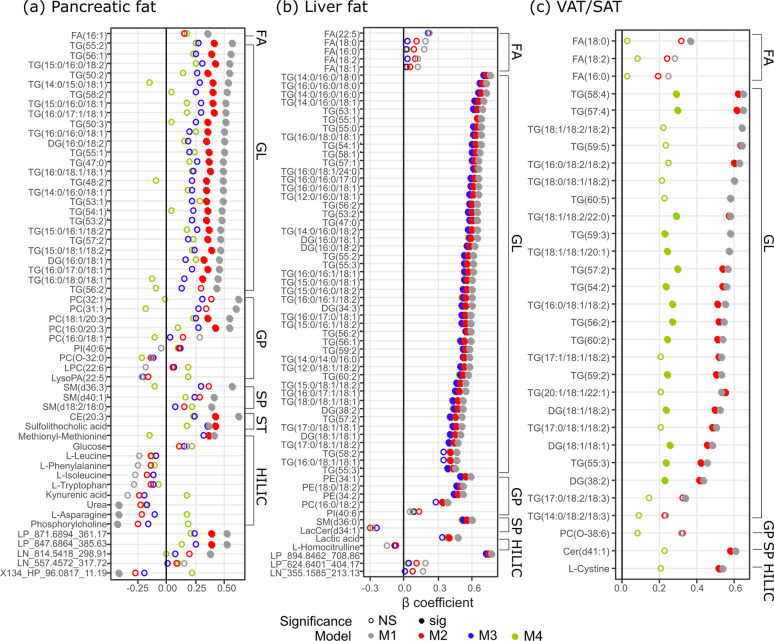
Fig. 3. Association of individual metabolite marker with ectopic fat deposition.
Association of individual metabolite markers with (a) pancreatic fat, (b) liver fat, (c) VAT/SAT ratio assessed by linear regression, with adjustment for ethnicity (M1), ethnicity + BMI + TBF(%) (M2); pancreatic fat and liver fat were further adjusted for VAT/SAT (M3); and additionally for age (M4). Significance tests were after multiple testing correction (p < 0.05). For the (b) liver fat age-adjusted model (M4, green) did not alter the β-coefficient therefore dots were mostly overlapped with M3; details of the β-coefficient values can be found in Table S5. Markers were categorised by classes and within each class, ordered by β-coefficient in M1 from the highest to the lowest. FA fatty acyls, GL glycerolipids, GP glycerophospholipids, SP sphingolipids, ST sterol lipids, HILIC HILIC-measured polar metabolites.

