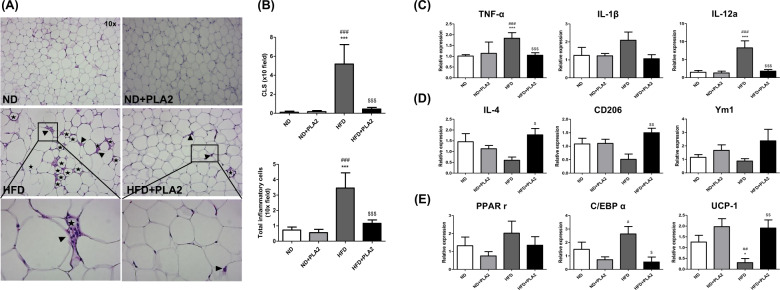
Fig. 3. Treatment of bvPLA2 decreased the accumulation of macrophages in AT by controlling the M1 or M2-phenotypic markers and adipogenic factors.
A Representative H&E-stained eWAT sections. The images in the black-lined box are magnified (bottom panel). Crown-like structures (CLS) formed by dead adipocytes are marked with stars, and infiltrated macrophages are indicated with black arrows head. B The number of CLS and infiltrated macrophages in adipose tissue. Relative expression levels of the C M1-like markers TNF-α, IL-1β, and IL-12a and D M2-like markers IL-4, CD206, and Ym1 in the adipose tissue were assessed by quantitative real-time PCR. The adipogenic markers E PPARγ, C/EBPα, and UCP-1 in the adipose tissue were analyzed by quantitative real-time PCR. All data represented as the means ± SEMs; *P < 0.05, ***P < 0.0001 versus the ND group; #P < 0.05, ##P < 0.01, ###P < 0.0001 versus the ND + PLA2 group; $P < 0.05, $$P < 0.01, $$$P < 0.0001 versus the HFD group; n = 6.

