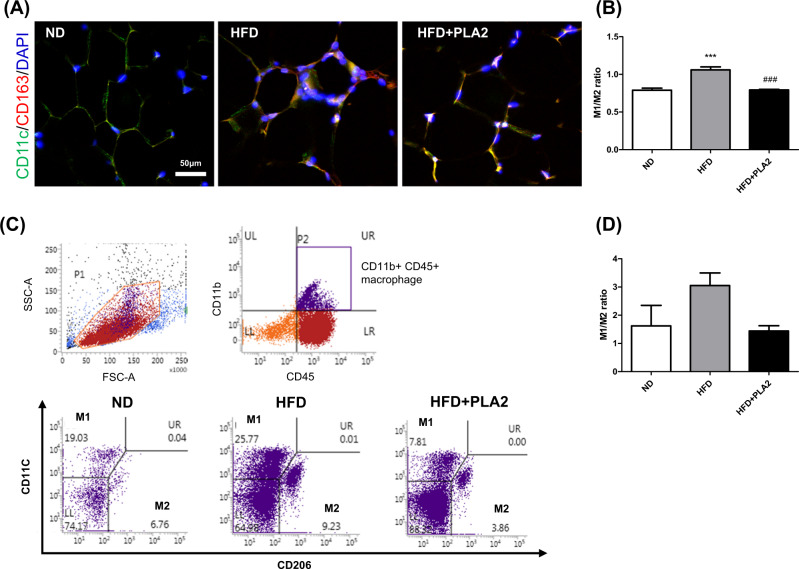
Fig. 5. bvPLA2 treatment decreased the M1/M2 ratio in HFD-induced obese mice.
A, B Frozen eWAT sections stained for CD11c (green), CD163 (red), and DAPI (blue) are shown. Scale bar in all images = 50 μm. C ATMs were stained with antibodies against CD45, CD11b, CD11c, and CD206 and examined by FACS analysis. Plots showing the percentages of M1/M2-like ATMs among the CD45+CD11b+ cells. D The ratio of classically activated M1-like ATMs (CD11c+CD206−) and alternatively activated M2-like ATMs (CD206+CD11c−) measured by FACS. All data are represented as the mean ± SEMs; ***P < 0.0001 versus the ND group; ###P < 0.0001 versus the HFD group; n = 4–5 (color figure online).

