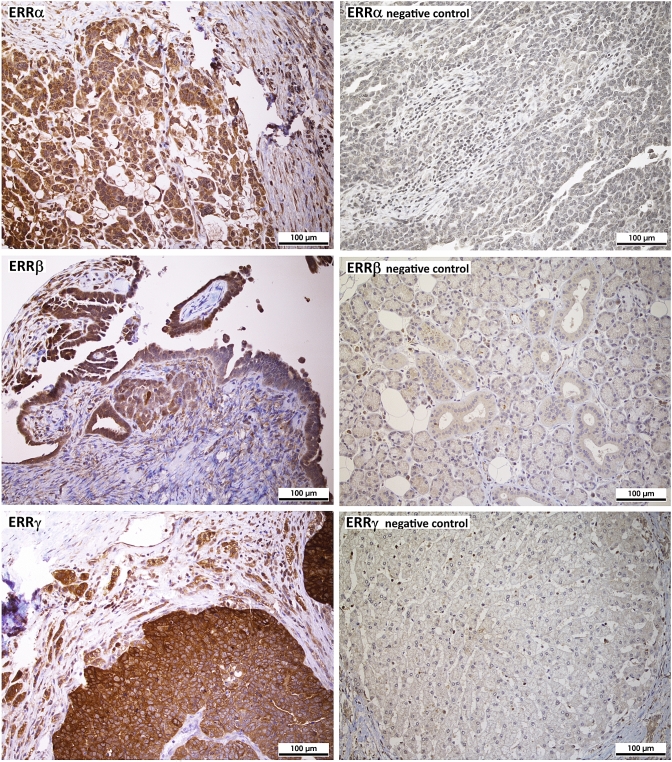
Fig. 1.
Analysis of protein expression of the indicated ERRs in ovarian cancer tissue microarrays (TMAs) by immunohistochemistry (200 × magnification). On the left side, three representative examples of positive staining of the indicated receptors in serous high-grade ovarian cancer tissue (G3) is shown. On the right side, examples for negative staining are shown (top: negative ovarian cancer tissue, middle: salivary gland, bottom: liver). The absence of ERRβ and γ expression in these tissues is confirmed by data of www.proteinatlas.org

