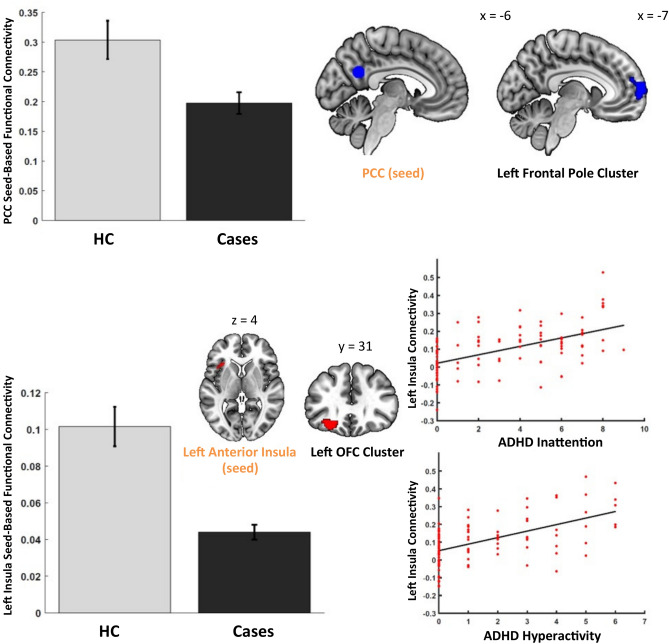
Fig. 1.
Significant results from the case–control functional connectivity analysis. The bar charts show a reduced seed-to-voxel connectivity pattern for cases compared to healthy controls (HC). The seeds and corresponding projections are mapped onto a brain diagram. The scatterplots depict the main effect of ADHD inattention, and hyperactivity counts in cases plotted against the connectivity values between the seed in the left anterior insula and projection in the left orbito-frontal cluster

