
Figure 2.
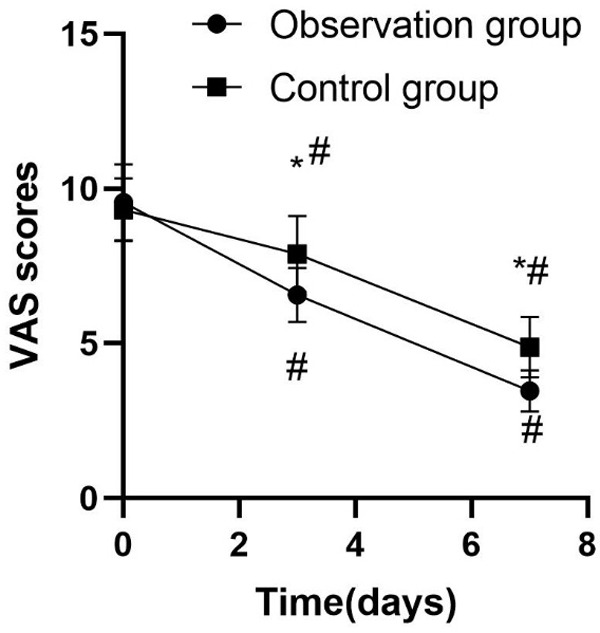
Comparison of VAS scores between two groups before and after treatment. * means comparison of VAS scores between the observation group and the control group, P<0.05; # indicates comparison of VAS scores after treatment with those before treatment at different time points, P<0.05.