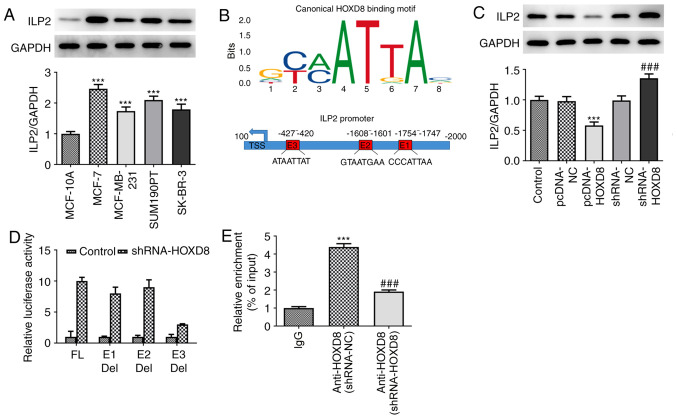
Figure 4.
Association between HOXD8 and ILP2. (A) ILP2 protein expression in breast cancer cell lines was detected by western blotting. ***P<0.001 vs. MCF-10A; n≥3. (B) JASPAR analysis was used to identify putative HOXD8-binding elements within the ILP2 promoter region. The x-axis represents the position of the base, and the y-axis represents the probability of a base in the corresponding position. The larger the letter, the greater the probability of the base. (C) ILP2 protein expression in MCF-7 cells following HOXD8 overexpression or knockdown was detected by western blotting. ***P<0.001 vs. pcDNA-NC; ###P<0.001 vs. shRNA-NC; n≥3. (D) Relative luciferase activity was assessed using a dual-luciferase reporter assay. (E) Relative enrichment of ILP2 was evaluated using chromatin immunoprecipitation and quantitative PCR. ***P<0.001 vs. IgG; and ###P<0.001 vs. shRNA-NC; n≥3. Del, deletion; E1/E2/E3, promoter elements; FL, full length; HOXD8, homeobox D8; ILP2, inhibitor of apoptosis-like protein-2; NC, negative control; shRNA, short hairpin RNA.

