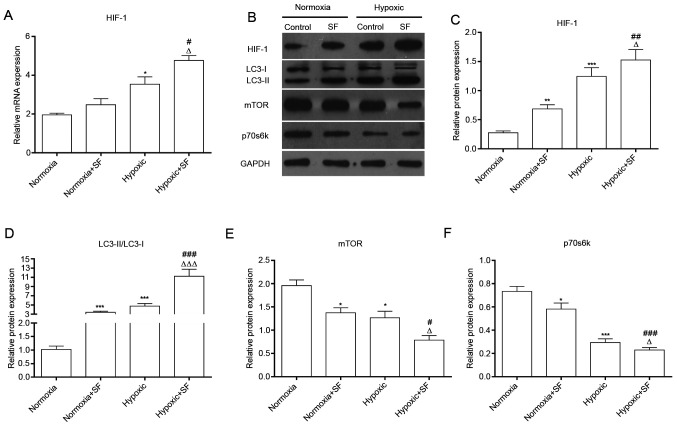
Figure 2.
SF upregulates HIF-1, LC3II/I and downregulates mTOR and p70s6K in HepG2 cells under hypoxia. (A) After treatment with SF, total mRNA was collected and expression level of HIF-1 was measured by reverse transcription quantitative PCR in HepG2 cells under normoxia and hypoxia. (B) Proteins from treated HepG2 cells were collected and the expression of HIF-1, LC3, mTOR and p70s6K was determined using western blotting. (C-F) Relative protein expression of HIF-1, LC3II/I, mTOR and p70s6K was quantified. *P<0.05, **P<0.01 and ***P<0.001 vs. normoxia group. #P<0.05, ##P<0.01 and ###P<0.001 vs. normoxia + SF group. ∆P<0.05, ∆∆∆P<0.001 vs. hypoxic group. Data are presented as the means ± standard deviation (n=3). SF, sorafenib; mTOR, mammalian target of rapamycin; HIF-1, hypoxia-inducible factor-1; p70s6k, p70 ribosomal S6 kinase.

