Figure 5.
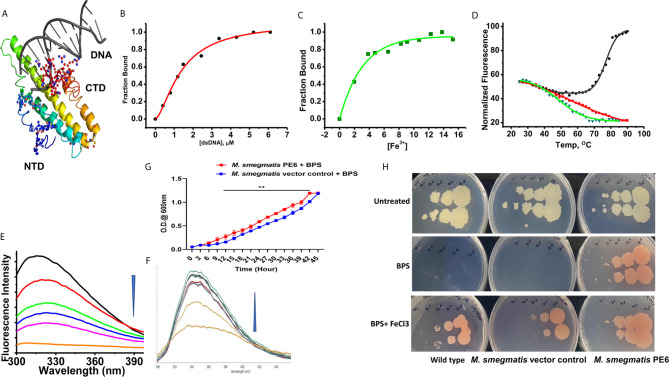
PE6 binds to DNA and iron and M. smegmatis harboring pe6 grown in iron-depleted liquid and solid media. (A) PE6-DNA modeled structure. Putative DNA binding regions are shown as spheres along with N-terminal and C-terminal domains. (B–D) Nonlinear curve fitting analysis to determine the apparent dissociation constant from titrations of PE6 with (A) dsDNA, (B) Fe. (C) FTS assay to determine the melting temperature (Tm) of PE6 alone (Black) and in the presence of dsDNA (Red) and Fe (Green). (E, F) Changes in fluorescence emission spectra (300–400 nm) upon the titration of (E) dsDNA and (F) Fe against PE6. (G) Growth kinetics of recombinant M. smegmatis harboring pe6 and vector alone transformed cells in liquid broth containing iron chelator. O.D600 nm was taken at different time intervals, as marked in the graph. pe6 containing M. smegmatis grows significantly faster than vector alone transformed cells. (H) The growth pattern of recombinant M. smegmatis containing pe6 and vector alone transformed cells in solid media with and without iron chelator and supplementation with Fecl3. The upper panel shows the growth pattern of untreated wild-type, vector alone, and pe6 transformed cells, and the middle and the lower panel shows the growth pattern of wild-type M. smegmatis, recombinant M. smegmatis containing pe6, and vector alone transformed cells in the presence of BPS and BPS + Fecl3. Some 10-fold serial dilutions were plated, and growth was observed on the fourth day after plating. Data were analyzed by two-way ANOVA with Sidak’s multiple comparison post-test. Data are representative of three independent experiments. **P < 0.01 vs. controls.

