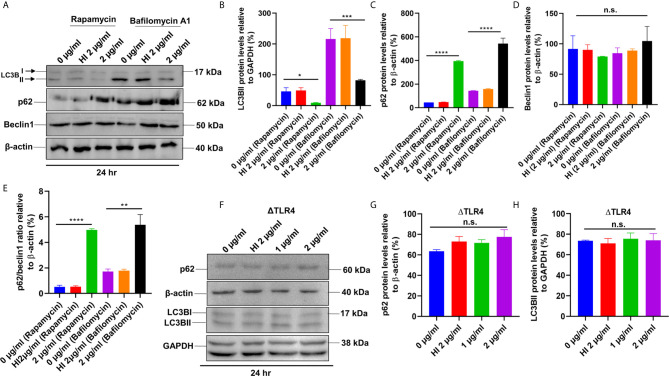
Figure 8.
PE6 inhibits autophagy initiation of RAW264.7 cells in the presence of rapamycin and bafilomycin A1. (A) Western blot showing the levels of autophagy markers LC3BII, p62, and Beclin1 in RAW264.7 cells treated with PE6 in the presence of rapamycin (200 nM) and bafilomycin A1 (50 nM). Untreated and HI PE6 treated cells were used as negative controls. β-actin and GAPDH were used as loading controls. (B–E) Densitometric quantifications of LC3BII, p62, and Beclin1 bands are shown relative to β-actin and GAPDH [%]. p62/Beclin1 ratio is shown as a bar graph. (F) Western blot demonstrating the levels of p62 and LC3BII in ΔTLR4 mouse macrophage cells. β-actin and GAPDH were used as loading controls. Untreated and HI PE6 treated cells were used as negative controls. (F–H) Densitometric analysis of p62 and LC3BII bands relative to β-actin. Data were analyzed by one-way ANOVA with Tukey’s multiple comparison post-test. Data are representative of two independent experiments. *P < 0.05, **P < 0.01, ***P < 0.001, ****P < 0.001 vs. controls. n.s; difference not significant.

