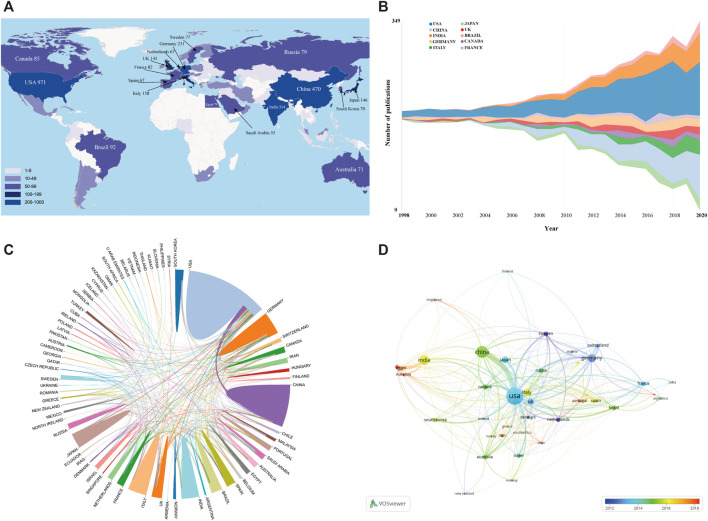
FIGURE 3.
(A) Geographical distribution based on the total number of scientific publications about intranasal delivery research. (B) The annual publications of the top 10 countries from 1998 to 2020. (C) The international cooperation among relevant countries/regions. (D) The country co-authorship overlay visualization map using VOS viewer. Each node represents an individual country, and the node size is proportional to the number of publications. Line thickness between nodes indicates link strength of a collaboration relationship (weighted by a quantitative evaluation indicator of TLS).

