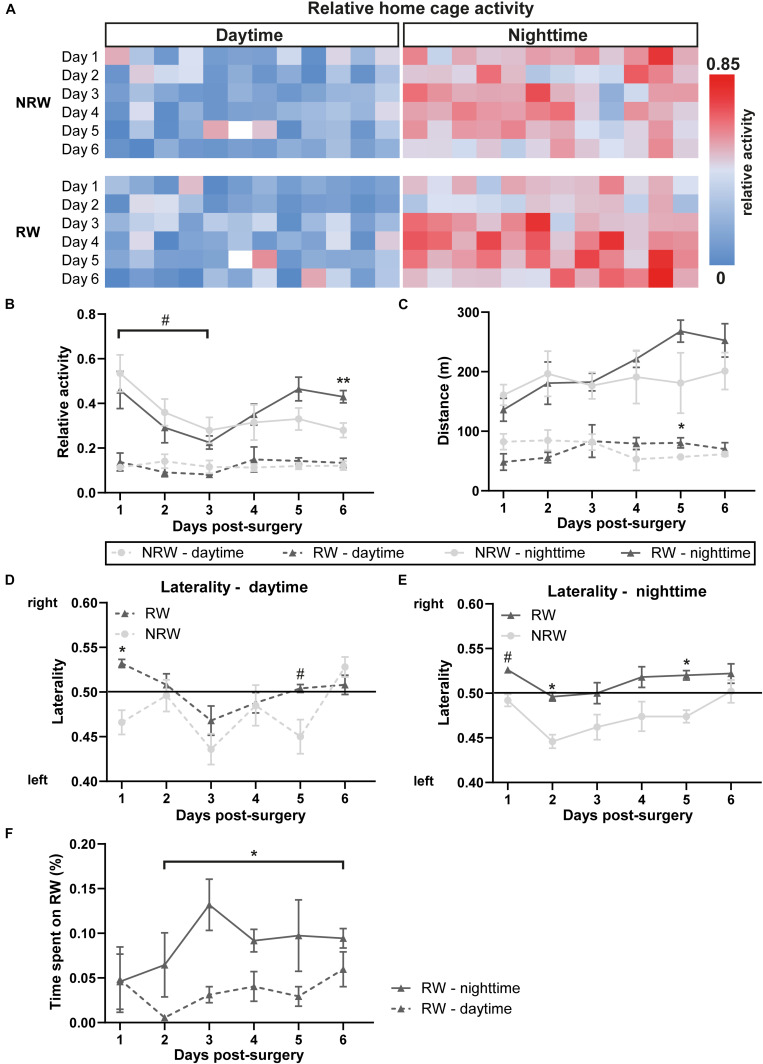
FIGURE 3.
(A) Heatmaps showing average home cage activity per hour in RW and NRW mice recorded during 6 days post-surgery. Mice were exposed to a 12 h light cycle. DVC activity metrices were measured in RW and NRW mice during 1 week post-stroke, including (B) relative home-cage activity (day- and nighttime), (C) walked distance inside the home-cage (day- and nighttime), (D) daytime and (E) nighttime laterality index, and (F) the relative time spent on the running wheel. RW: N = 5, NRW: N = 5; values represented in mean ± SEM. #0.05 < p < 0.08 (tendency); *p ≤ 0.05; **p ≤ 0.01.

