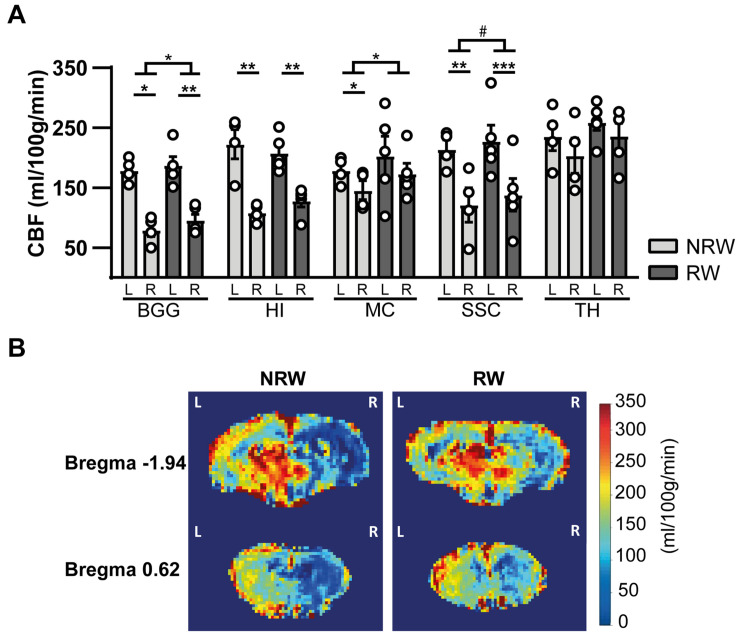
FIGURE 5.
(A) Cerebral blood flow (CBF) 6 days after stroke induction assessed in different ROI (BGG: Basal ganglia, HI: Hippocampus, MC: Motor cortex, SSC: Somatosensory cortex) of running wheel (RW) and no running wheel (NRW) mice. (B) Representative high-resolution voxel-wise CBF images of two different bregma’s (–1.94 and 0.62) that were assessed in the NRW and RW group. RW: N = 5, NRW: N = 4; values represented in mean ± SEM. #0.05 < p < 0.08 (tendency); *p ≤ 0.05; **p ≤ 0.01; ***p ≤ 0.001.

