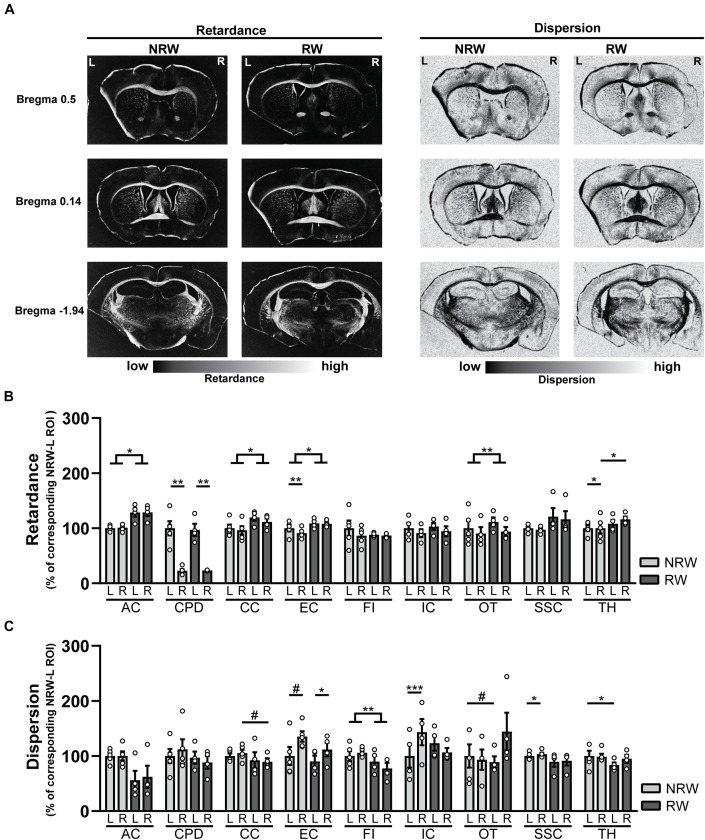
FIGURE 8.
(A) Representative images of retardance and dispersion maps of both running wheel (RW) and no running wheel mice (NRW) 1 week post-stroke, taken at the level of bregma 0.14, 0.5, and –1.94. (B) Retardance and (C) dispersion assessed with polarized light imaging (PLI) in the ipsilateral (R: right) contralateral (L: left) hemisphere of several ROI (AC: anterior commissure, CPD: cerebral peduncle, CC: corpus callosum, EC: external capsule, FI: fimbria, HI: hippocampus, IC: internal capsule, MC: motor cortex, OT: optic tract, SSC: somatosensory cortex, TH: thalamus). RW: N = 5, NRW: N = 4; values represented in mean ± SEM. #0.05 < p < 0.08 (tendency); *p ≤ 0.05; **p ≤ 0.01; ***p ≤ 0.001.

