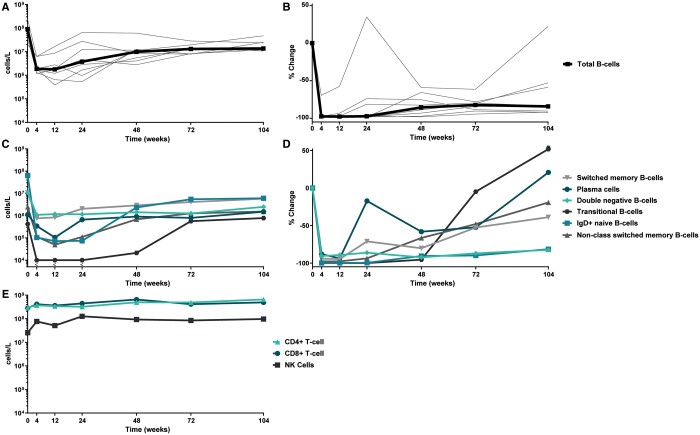
FIGURE 3.
Longitudinal kinetics of circulating immune cells >2 years of follow-up after RTX + BLM treatment (n = 8 responders). (A and B) RTX + BLM prevents the complete repopulation of circulating B cells. Depicted are individual values of all responders with the median in bold representing change of CD19+ B cells in (A) absolute numbers and (B) the percentage of change from baseline. (C and D) Repopulation of B-cell subsets upon RTX + BLM. Depicted are the median change from baseline in (C) absolute numbers and (D) the percentage of change of the following B-cell subsets: plasmablasts (CD3−CD38brightCD27brightCD19+), non-switched memory B cells (CD3−CD19+CD27+IgD+), switched memory B cells (CD3−CD19+CD27+IgD−), naïve B cells (CD3−CD19+CD27−IgD+), DN B cells (CD3−CD19+CD27−IgD−) and transitional B cells (CD3−CD19+ CD38brightCD24bright). (E) Significant reconstitution of circulating CD4+ T cells (CD3+CD4+), CD8+ T cells (CD3+CD8+) and NK cells (CD16+CD56+). Depicted are the median changes from baseline in absolute numbers.

