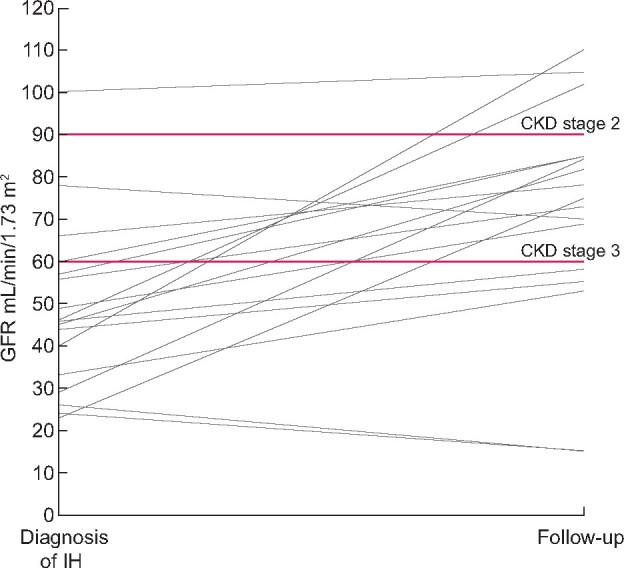
FIGURE 3.

Changes of eGFR from the first observation at diagnosis of IH to the last observation at follow-up. In two patients who developed ESRD and were then transplanted the last eGFR was set as 15 mL/min/1.73 m2. Two horizontal lines were set at values of 90 and 60 mL/min/1.73 m2 to discriminate CKD Stages 2 and 3.
