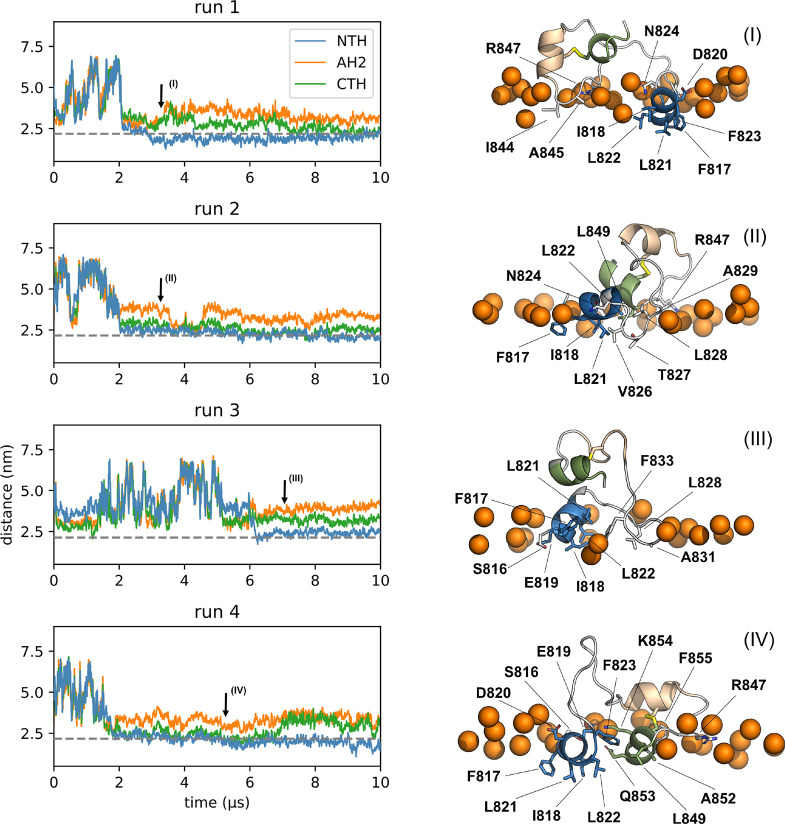
Figure 2.
NTH binding to the endosomal membrane. (Left) Distances of the centers of mass of the three helices and the center of mass of the membrane. The average phosphate position of the bound leaflet is indicated by a gray dotted line. Arrows indicate times for snapshots in right panel. (Right) Representative snapshots of states bound to the membrane. Colors as in Figure 1 (NTH: blue; AH2: beige; CTH: green). Membrane-inserted residues are labeled and shown in licorice representation. The upper membrane boundary is indicated by phosphate headgroups of nearby lipids (orange spheres).

