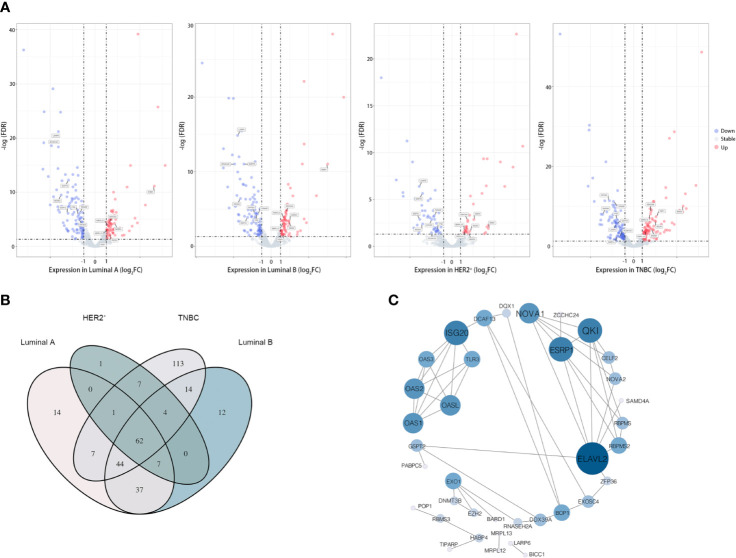
Figure 2.
62 RBPs were differently expressed in breast tumor samples. (A) Volcano plot showing the differently expressed RBPs in diverse subtype of breast cancer, from left to right was the Luminal A subgroup, Luminal B subgroup, HER2-positive subgroup (HER2+) and Triple-negative subgroup (TNBC). Moreover, 15 candidate RBPs which were screened by Lasso-penalized Cox regression analysis were labeled; (B) “Venn Diagram” illustrated the communal differently expressed RBPs between subtypes of breast cancer; (C) Protein–protein interaction (PPI) network of the overlapped 62 candidate RPBs in breast cancer, size of the node representing the value of relationship between RBPs.

