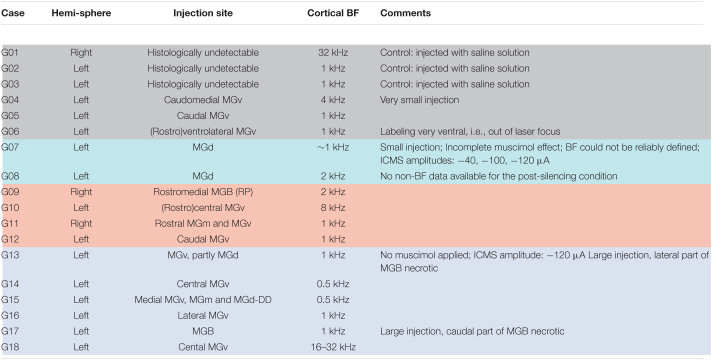
TABLE 1.
Experimental animals used for CSD analysisa.
aFor each case, the injected and illuminated hemisphere, intrathalamic location of the injection site, and the BF encountered at cortical recording site are depicted, and, where required, comments. Background colors indicate the respective group assignments defined by the lesion strengths, namely non-Les, LesV, LesVI, LesV+VI (see also Figure 2C). Control animals were injected into MGB with saline instead of the tracer solution.

