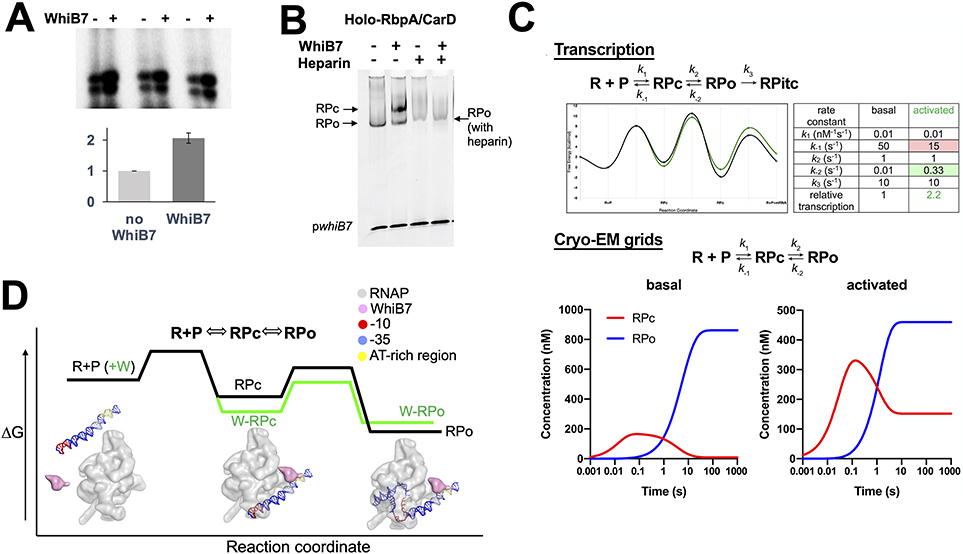
Figure 6. Kinetic modeling of WhiB7’s effect on the RPo formation pathway.
A. Representative transcription assays showing abortive transcripts synthesized from Mtb RNAP and Mtb RNAP/WhiB7 holoenzymes. The assay was performed in triplicate and the results were quantified and shown in the histogram. The activity of Mtb RNAP was normalized to 1 and the values are the average of triplicate experiments. The error bars denote the mean standard errors.
B. Native EMSA showing that WhiB7 increases Mtb holo-RbpA/CarD shifting of the pwhiB7 DNA. In the presence of WhiB7, two shifted bands are observed; one is resistant to heparin (RPo), the other is heparin-sensitive (RPc).
C. The transcript flux calculator (Galburt, 2018) was used to illustrate that an activator like WhiB7 could alter the kinetic parameters in a simple four-state kinetic model (Walter et al., 1967): R + P ⇄ RPc ⇄ RPo → RPITC to increase the steady state flux into RPITC by a factor of approximately 2. (top) Kinetic model (Galburt, 2018) and the definition of the kinetic parameters (see text). The table on the right lists the values of the rate constants for basal and activated transcription, yielding the energy profiles shown on the left (black line, basal; green line, activated) (Galburt, 2018). The calculated transcript flux for the basal conditions was normalized to 1. The activated conditions increase the transcript flux by a factor of 2.2 (Galburt, 2018). (bottom) Under the equilibrium conditions of cryo-EM grid preparation (no nucleotide substrates, so no transition of RPo into RPitc): R + P ⇄ RPc ⇄ RPo. The basal kinetic parameters (no WhiB7) yield only RPo at equilibrium, while the same changes in the kinetic parameters that activate transcription ~2-fold (A) result in the appearance of RPc in equilibrium with RPo at a ratio of about 1:3, similar to the experimental observation (Figure 1C). The concentration profiles were calculated from the kinetic parameters using Kintek Explorer (Johnson et al., 2009). To achieve this result, the rate of dissociation of RPc back to R+P was decreased, while the rate of dissociation of RPo back to RPc was increased (top). Examination of the energy landscapes shows that these changes effectively stabilize RPc with respect to RPo (top).
D. A schematic model for how WhiB7 could affect the free energy profile for a two-step mechanism of RPo formation on the whiB7 promoter (R+P O RPc O RPo) is shown. Superimposed are blob renditions of stable states (RPc and RPo), as observed in our structures (Figure 1B, C). The black line indicates the reaction in the absence of WhiB7 and the green indicates how WhiB7 could change the profile to both activate transcription and stabilize RPc with respect to RPo, as observed in (B).

