
Figure 2.
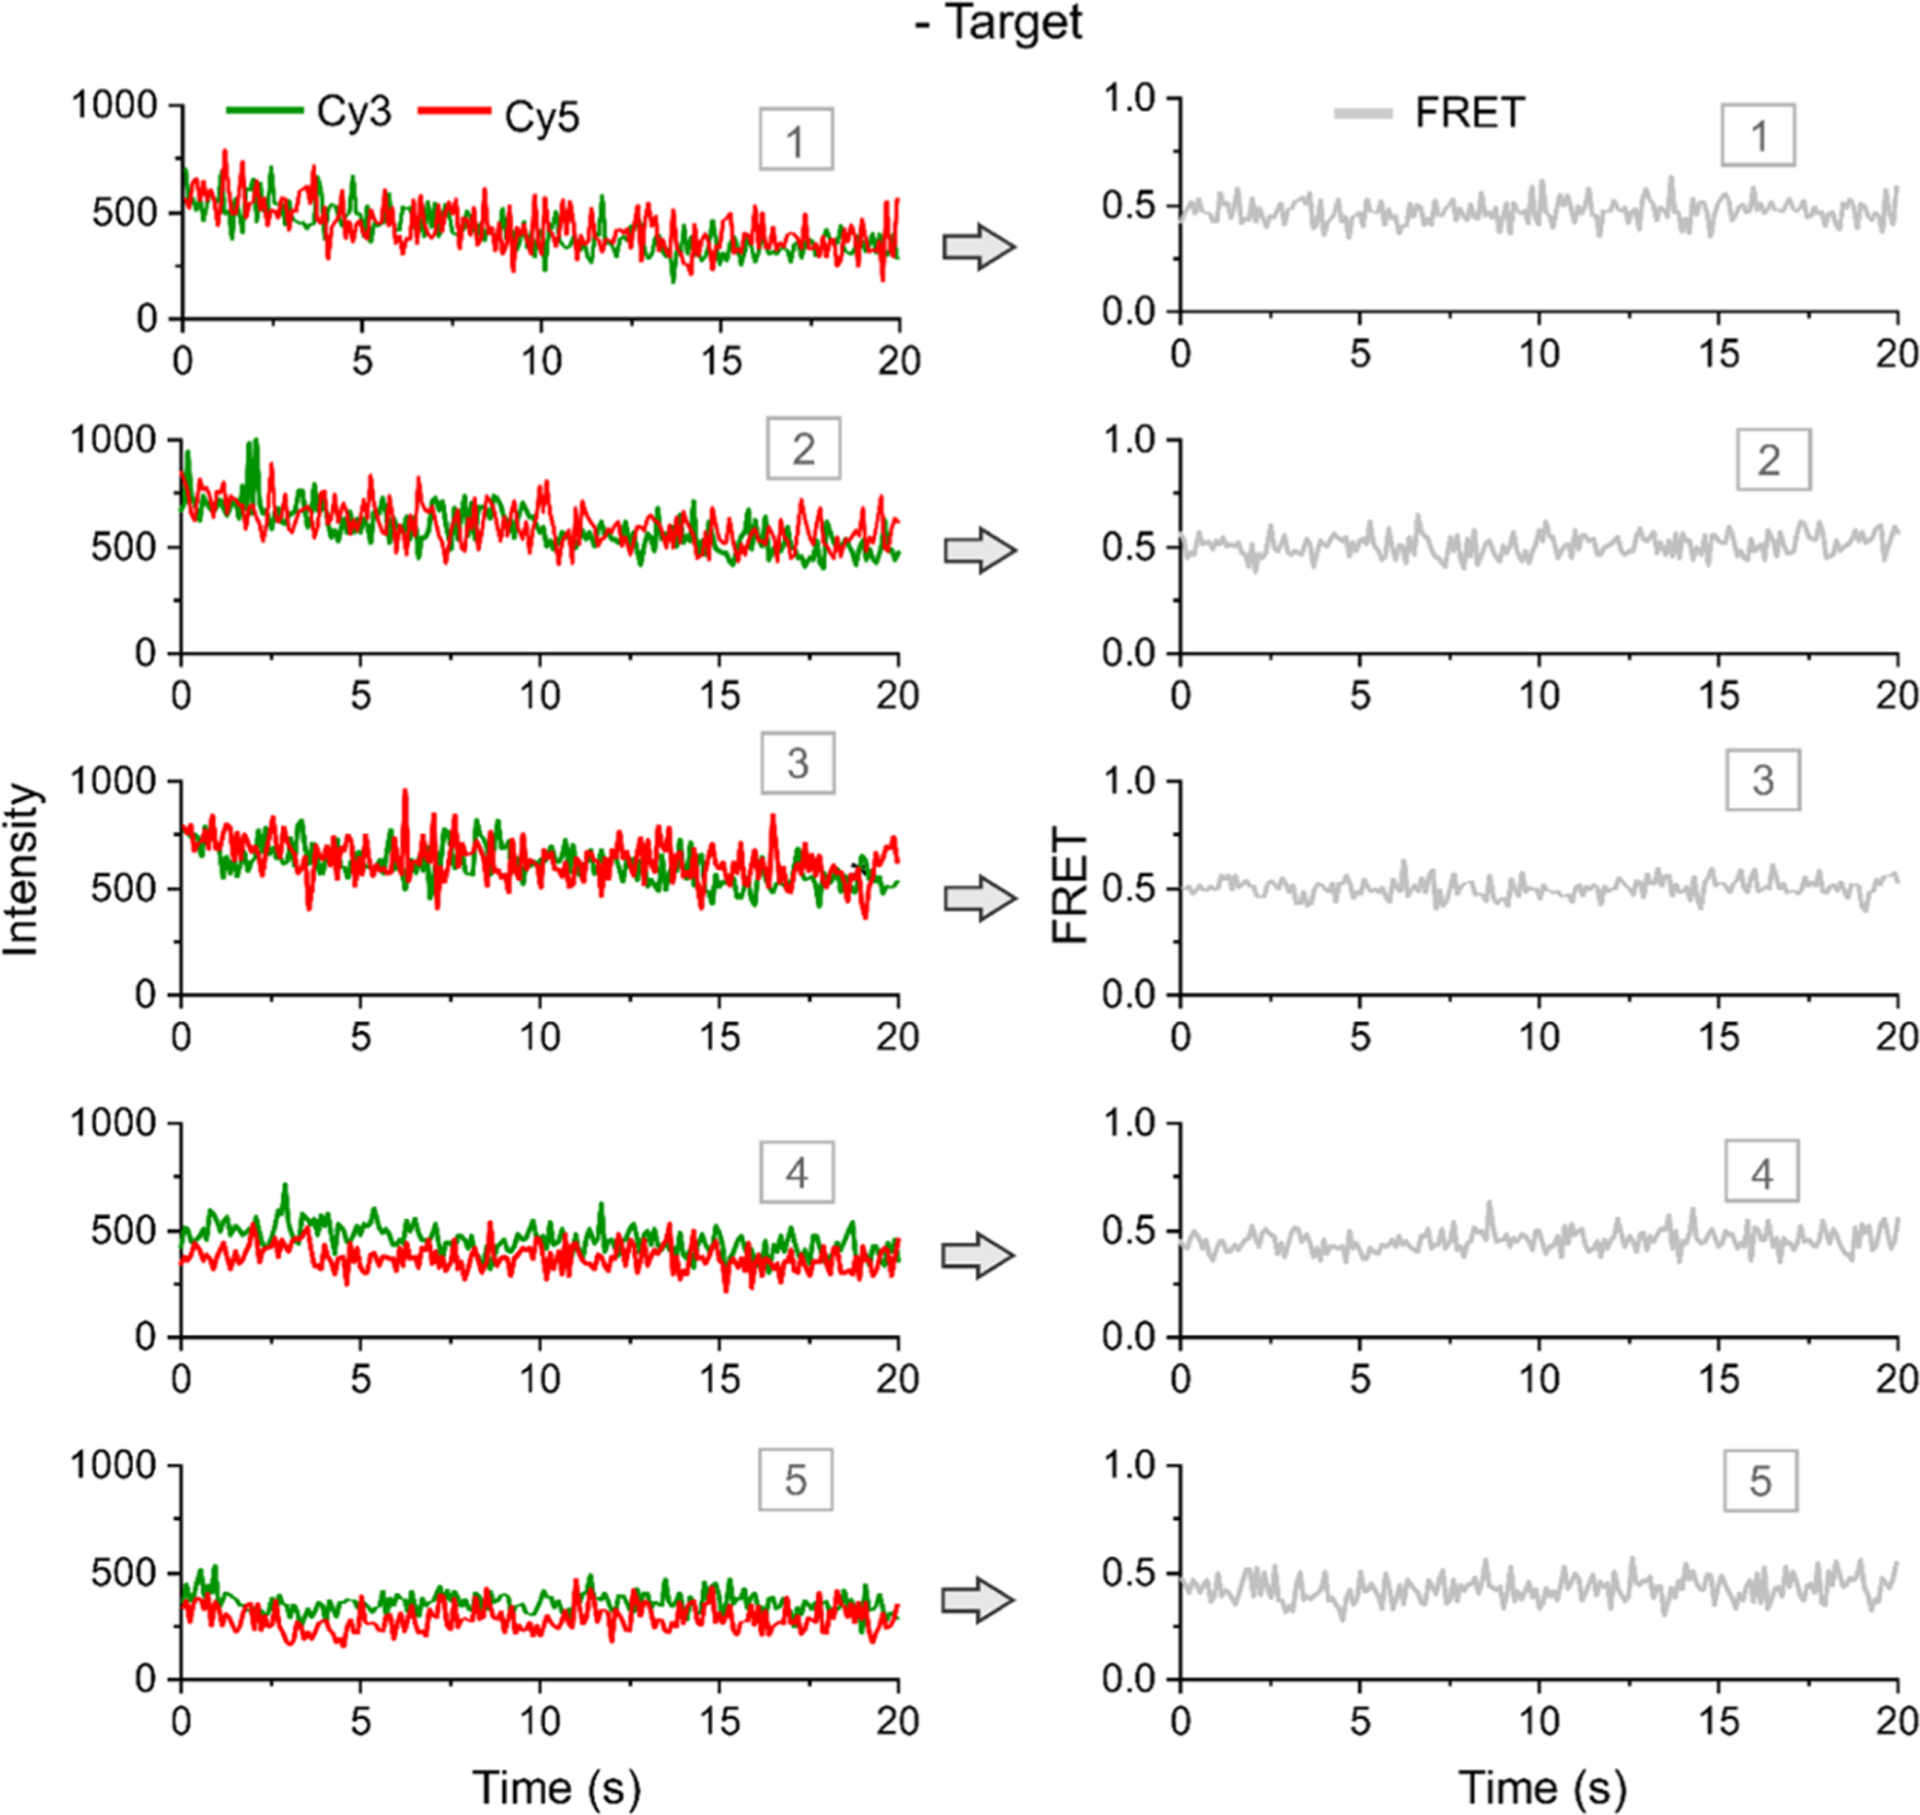
Typical single-molecule traces in the absence of a target. Typical intensity–time (left) and corresponding FRET–time traces (right). Five representative molecules are shown. The molecules exhibit static fluorescence intensities of Cy3 and Cy5 in the absence of a target, and a static FRET level of ~0.5 is observed in the absence of target DNA. All experiments are done at room temperature (23 °C). FRET represents FRET efficiency.