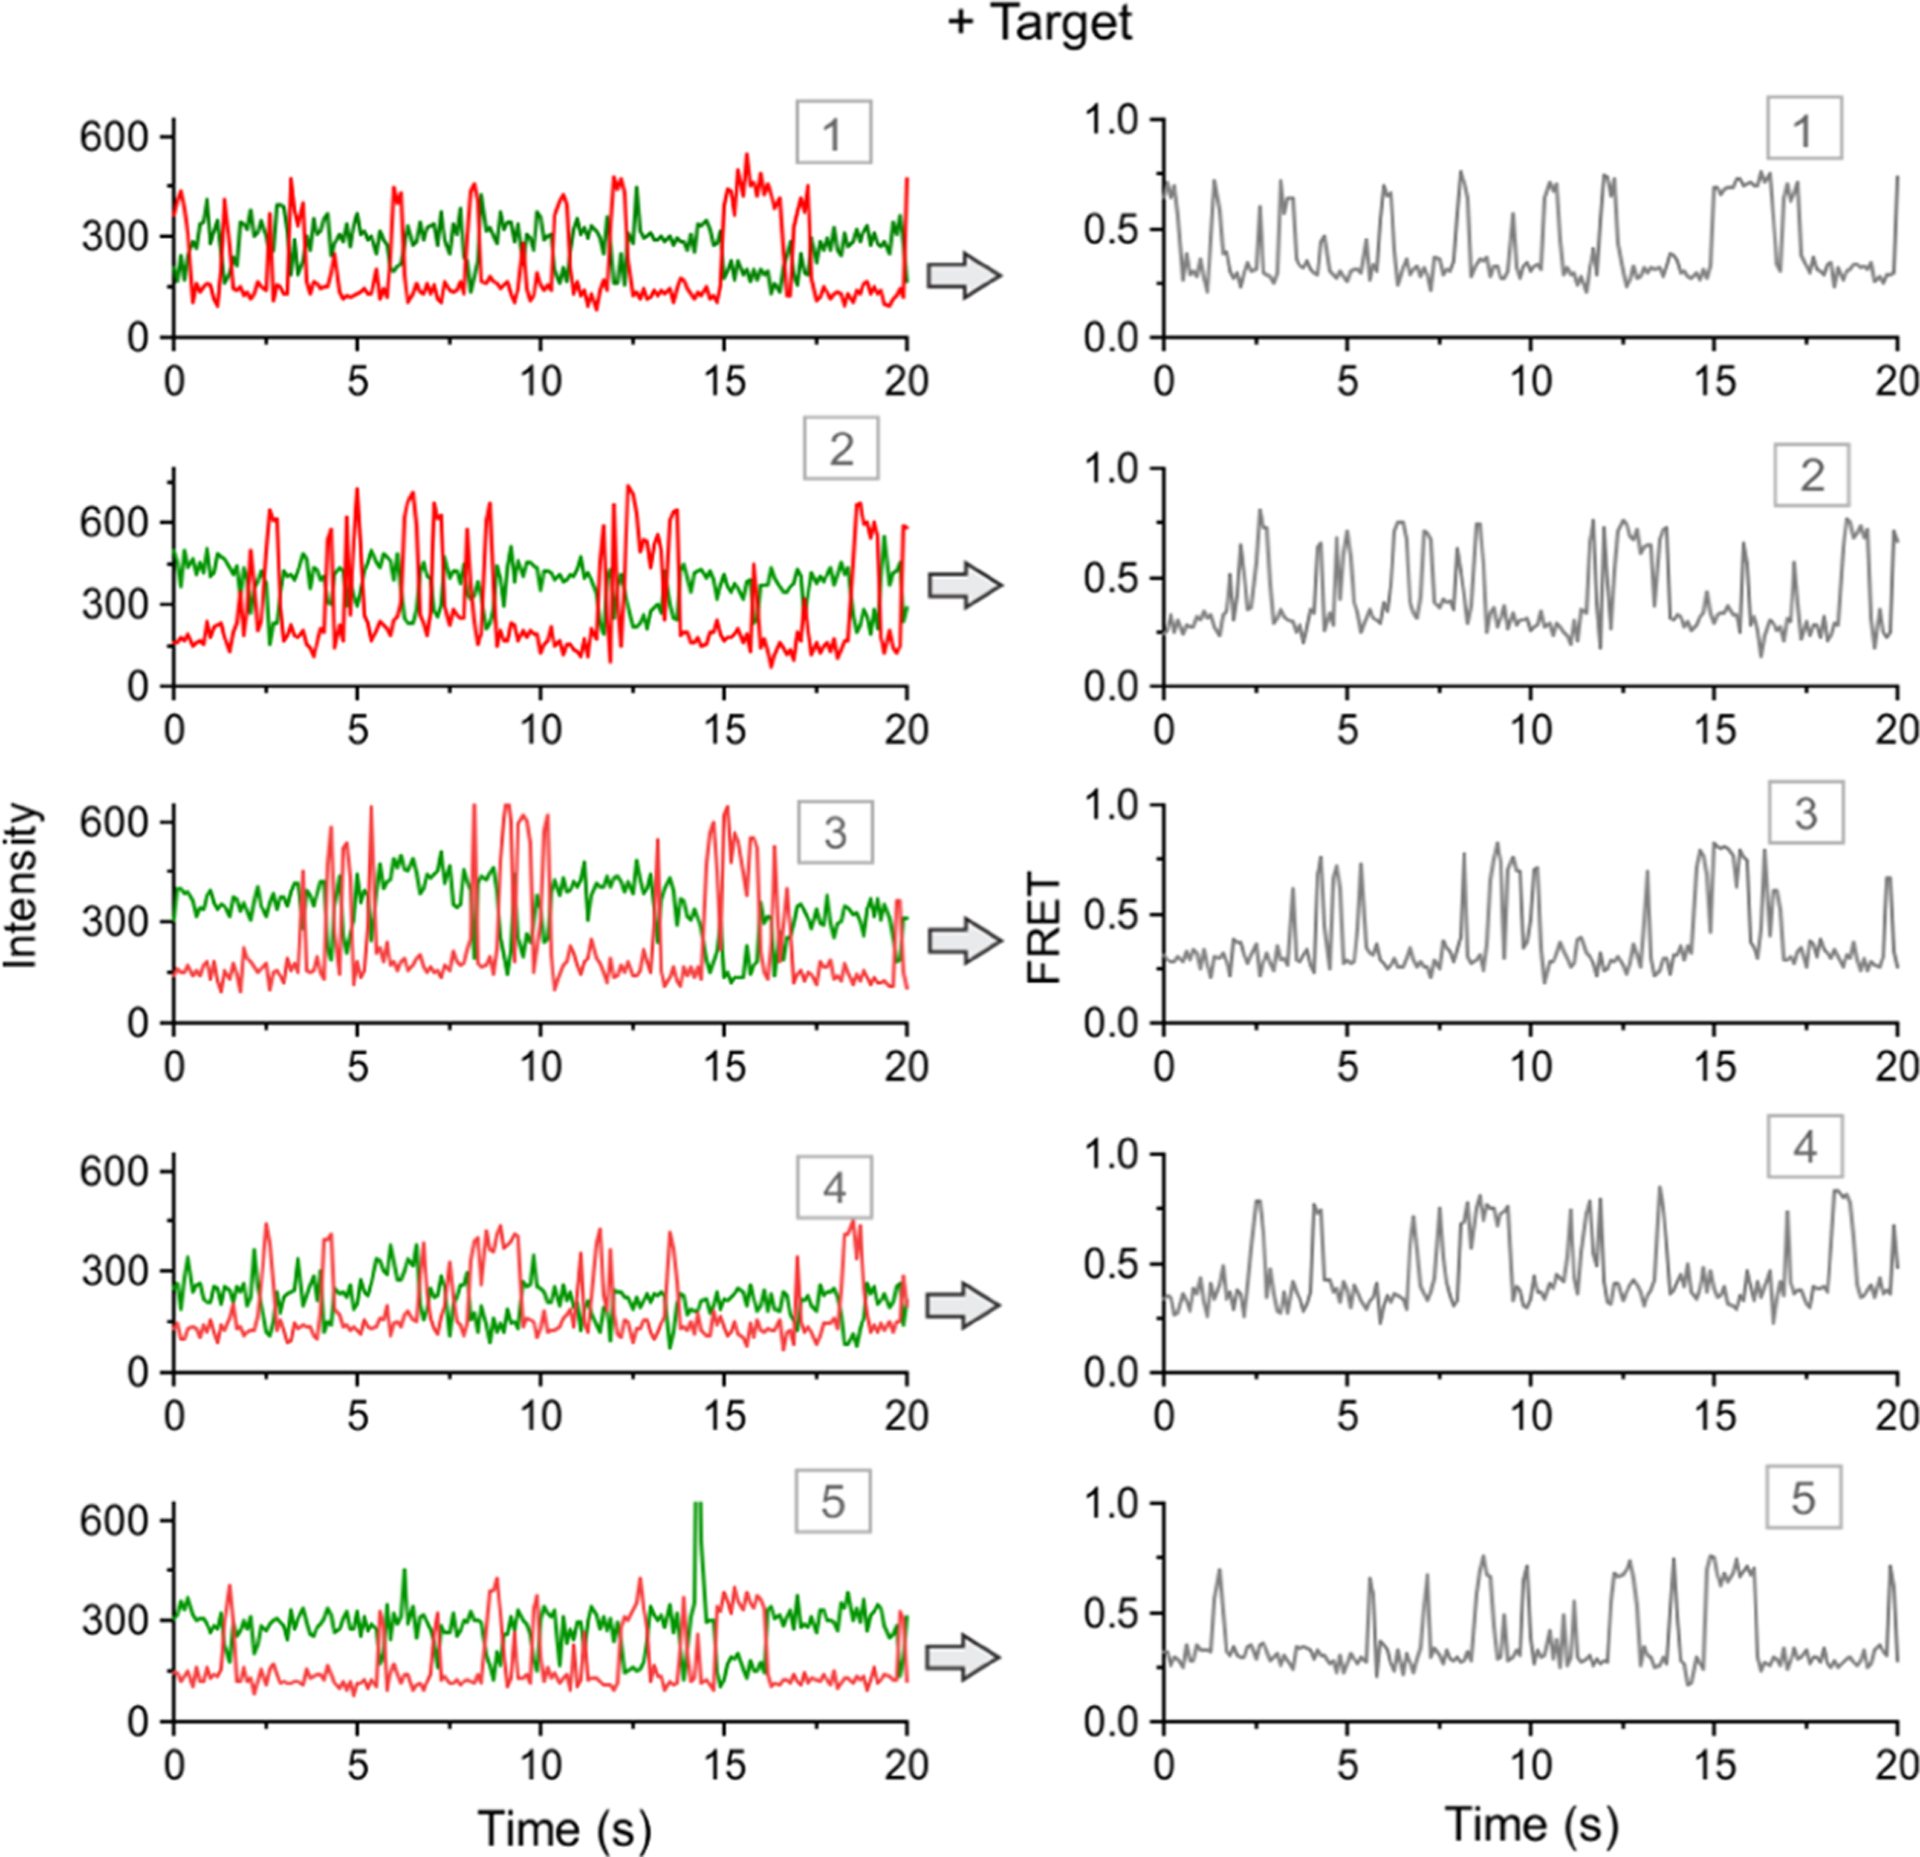
Figure 3.

Detection of a target sequence (p53 tumor suppressor gene) using single-molecule FRET. Typical intensity–time (left) and corresponding FRET–time traces. Five representative molecules are shown. The molecules exhibit dynamic and anticorrelated fluorescence intensities of Cy3 and Cy5. Such dynamic FRET–time traces with FRET levels of ~0.3 and ~0.7 are obtained only in the presence of target DNA. All of the experiments are performed at room temperature (23 °C). FRET represents FRET efficiency. Note that a slightly revised design to improve the sensor stability will be discussed later.
