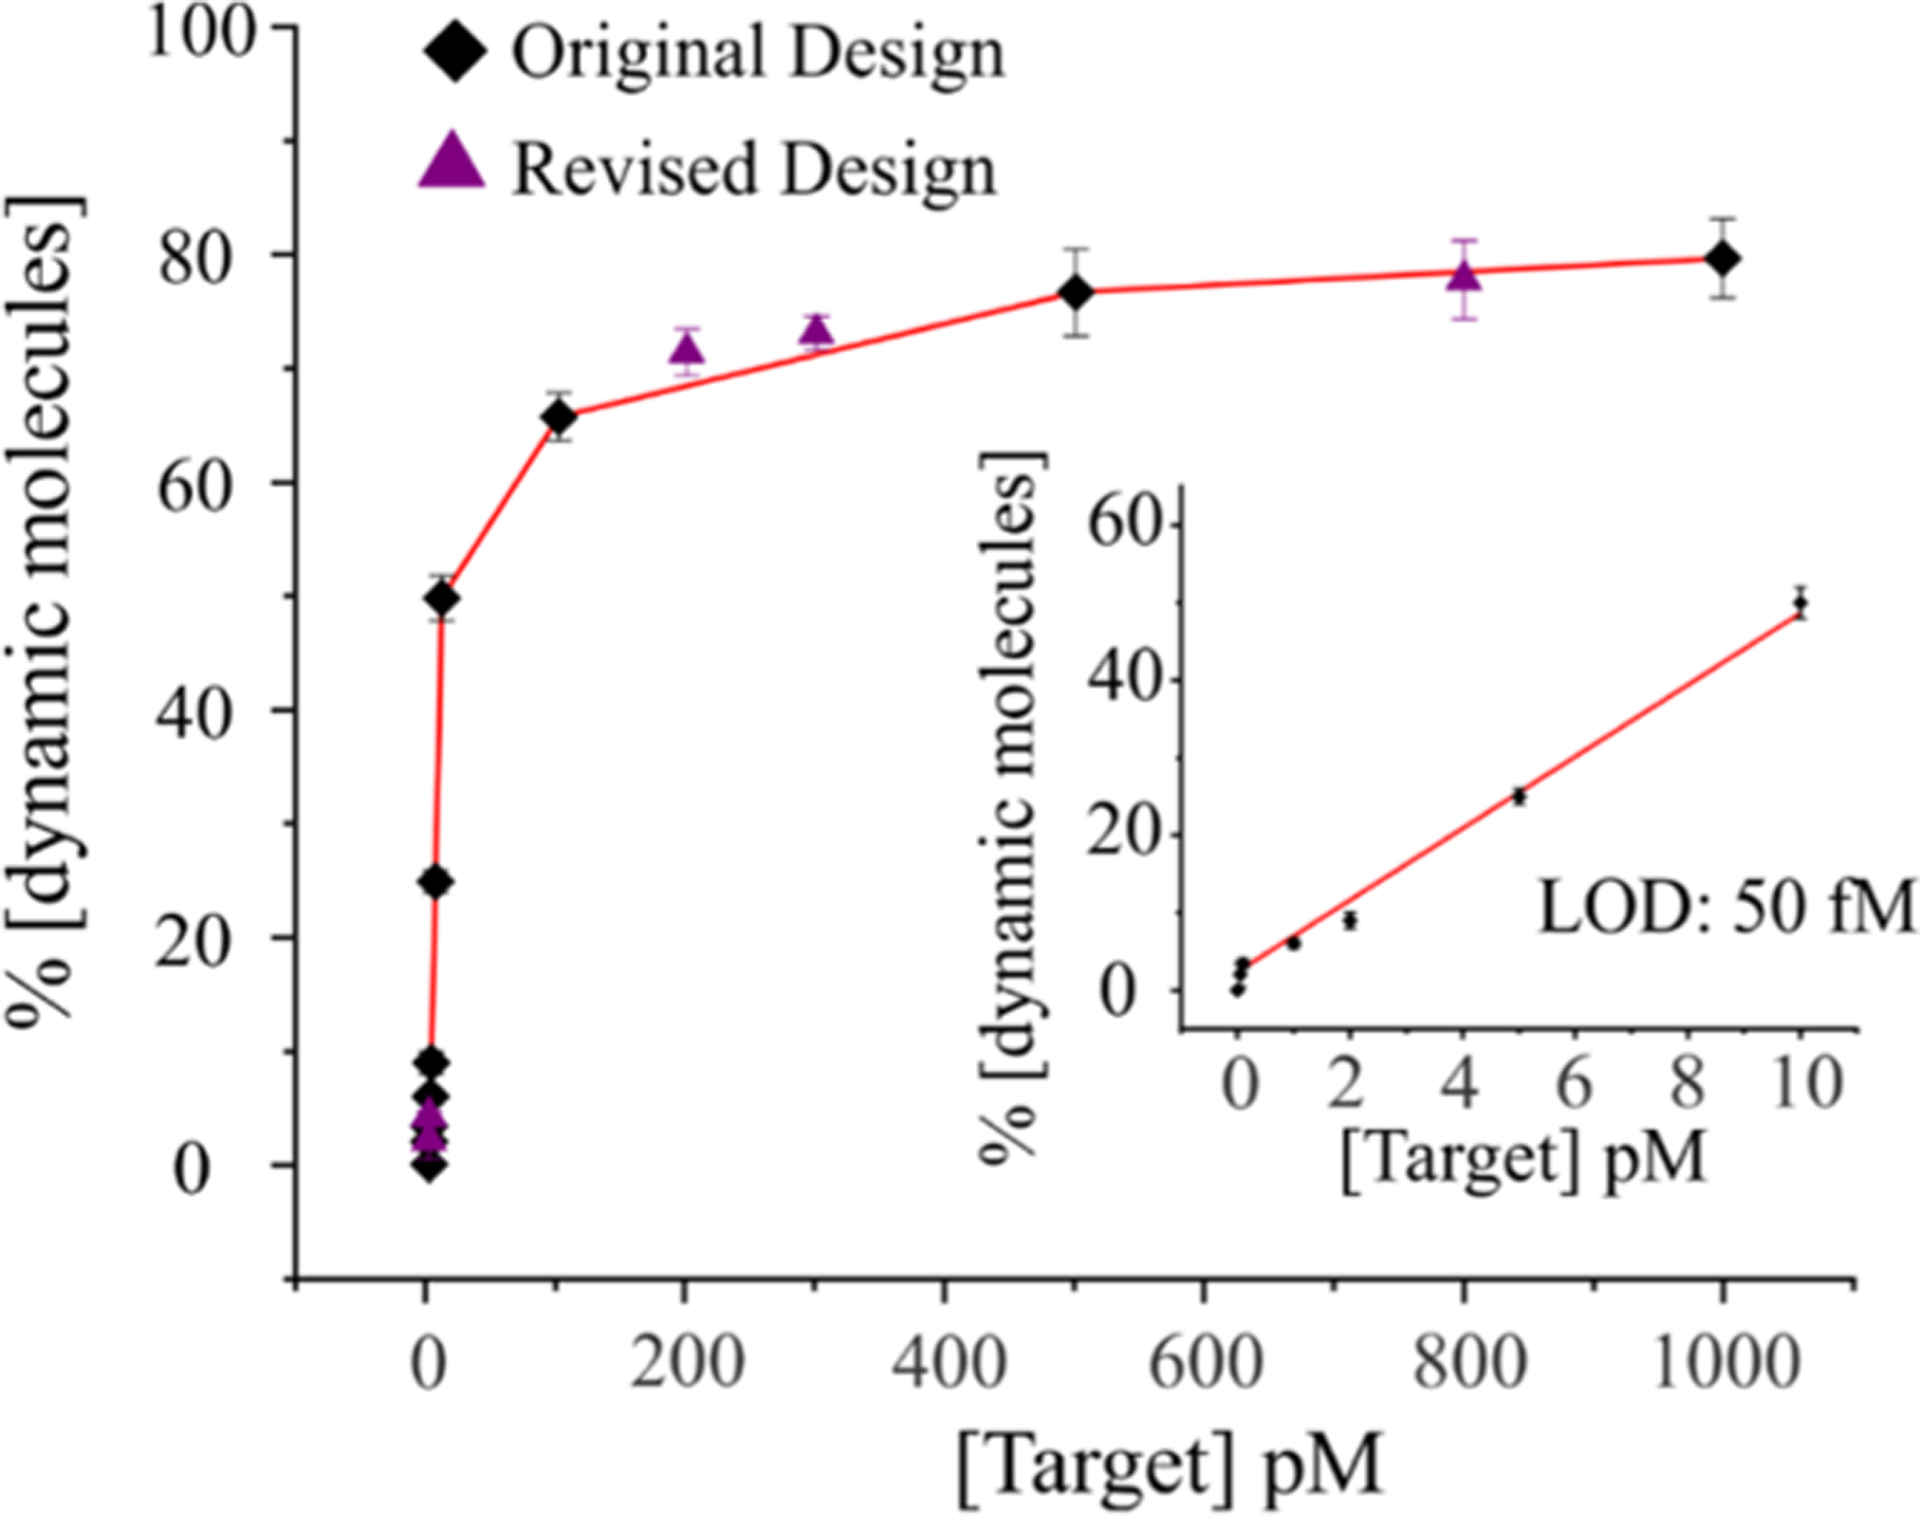
Figure 4.

Determination of the limit of detection (LOD). A calibration curve is obtained by plotting the number of dynamic molecules (≈target-bound molecules) as a function of the target concentration. The inset shows the linear range of the calibration curve with a LOD of 50 fM. Considering our experimental volume of ~100 μL, this LOD is equivalent to 5 attomoles of the DNA target (1 attomoles = 1 × 10⁻¹⁸ moles). The results for both the original and revised designs are shown. The percentage of dynamic molecules is determined from more than 150 single molecules at each concentration. The error bars represent the standard deviation from three groups of independent movie files.
