
Fig. 6.
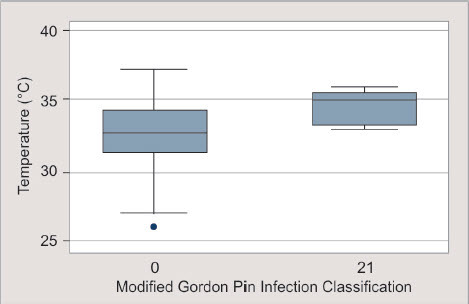
Box plot of the distribution of measured pin site temperatures stratified into grade 0 and above grade 0 (Modified Gordon Pin Infection Classification of the pin site). N (class 0) = 220, N (class ≥ 1) = 11
Official websites use .gov
A
.gov website belongs to an official
government organization in the United States.
Secure .gov websites use HTTPS
A lock (
) or https:// means you've safely
connected to the .gov website. Share sensitive
information only on official, secure websites.
Box plot of the distribution of measured pin site temperatures stratified into grade 0 and above grade 0 (Modified Gordon Pin Infection Classification of the pin site). N (class 0) = 220, N (class ≥ 1) = 11