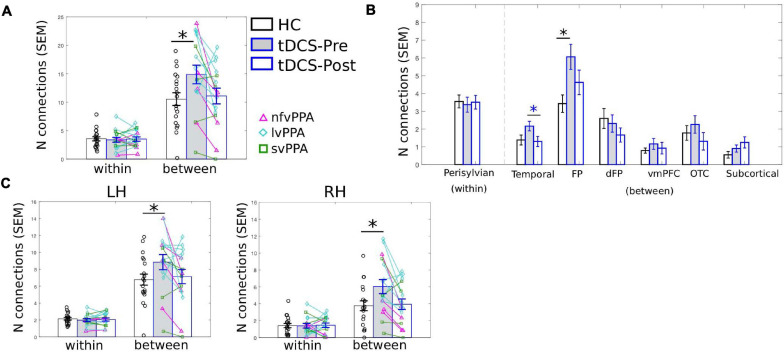
FIGURE 5.
LIFG-triangularis (LIFG-tri) changes in within-module and between-module connectivity of the tDCS group at pre- and post-treatment time points. The healthy control group (HC) is indicated by black, and the tDCS group before and after treatment by blue frames with gray and white fill, respectively. The three PPA variants are visualized with different colors and markers. ∗p < 0.05. SEM, standard error of the mean. (A) The number of within- and between-module connections of the LIFG-tri for the HC and the PPA groups before and after tDCS treatment. There were no time-point or group differences in terms of within-module connectivity. With regard to between-module connectivity, at pre-treatment, the tDCS group had more connections than the HC group, a difference that disappeared after treatment. (B) LIFG-tri connections by module. The within-module (perisylvian module) values are the same as in panel (A). For the between-module connections, a similar pattern of pre- to post-treatment normalization was observed for multiple modules, especially for the temporal and FP modules. (C) Numbers of within- and between-module connections of the LIFG-tri in each hemisphere. Individual hemisphere results were similar to the whole-brain results shown in panel (A).

