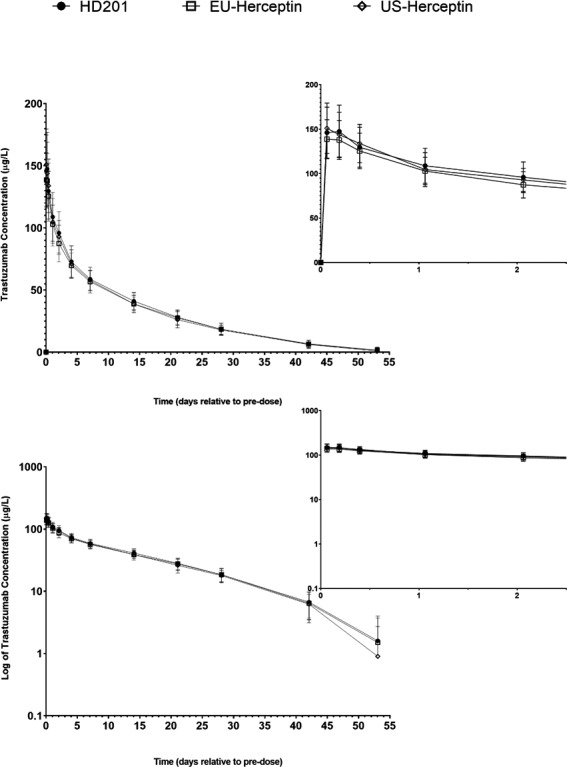
FIGURE 2.

Trastuzumab serum concentration–time profiles (PKC population). Mean (±SD) trastuzumab concentrations over time are shown for all three groups on a linear scale (upper panel) and a semi‐logarithmic scale (lower panel). Insets show zoom of the first 48 hours after end of infusion. Number of subjects with serum concentrations reported at each time are provided in the source table. Note: Mean trastuzumab concentrations = 0.0 µg/L are not plotted on the semi‐logarithmic graph; some error bars are not shown on the semi‐logarithmic graph as negative values cannot be plotted logarithmically. The curves were based on the PKC concentration with 34, 35 and 32 subjects in the HD201, EU‐herceptin and US‐herceptin groups respectively
