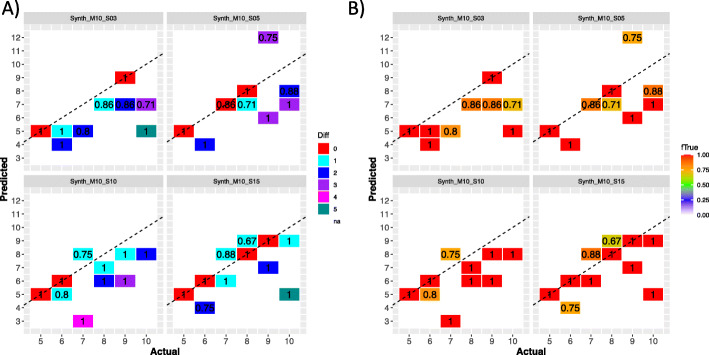
Fig. 6.
Strain numbers resolved by STRONG in the high strain diversity synthetic community data sets. A For each MAG we compare the actual number of strains against the predicted number. The number in each tile gives the total no. of MAGs observed with those values. The colour of a tile the divergence between true and predicted strain numbers. Results are shown for all four high strain diversity data sets: Synth_M10_S03, Synth_M10_S05, Synth_M10_S10 and Synth_M10_S15 for the STRONG algorithm only. The results of Pearson’s correlations between actual and predicted strain number were for Synth_M10_S03 (r = 0.62, p = 0.04), Synth_M10_S05 (r = 0.57, p = 0.11), Synth_M10_S10 (r = 0.59, p = 0.05), and Synth_M10_S15 (r = 0.52, p = 0.10). B The same data are shown but now for each tile we give the mean fraction of predicted strains that were ‘Found’ i.e. mapped uniquely onto a reference strain

