Fig. 3.
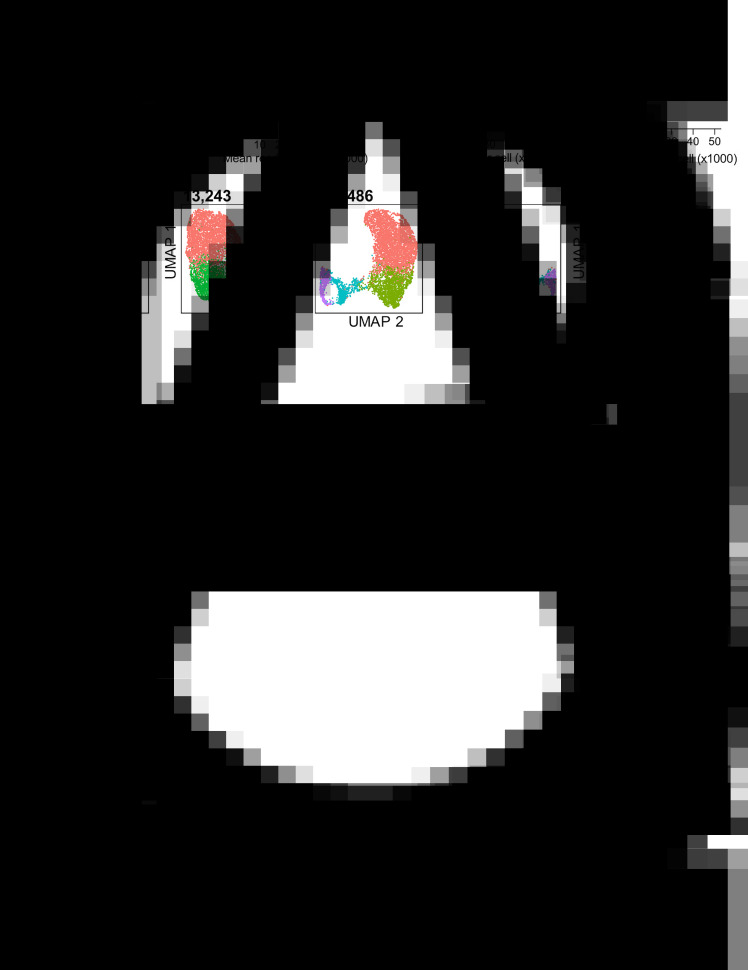
Evaluation of sequencing depth impact on cluster identification and differential gene expression analysis. T. brucei bloodstream form (Briggs et al., 2020) cells were previous subjected to Chromium scRNA-seq (Briggs et al., 2020) to a depth of 52,971 mean reads per cell. (A) Sequencing saturation [1−(number of unique reads/number of total mapped reads)] as calculated by cell ranger (10x Genomics, 2020a) for between 5,000 and 52,971 mean reads per cell. The dashed line is equal to 0.9 (90%) sequence saturation. (B) Median genes per cell for total sequencing (52,971 mean reads per cell) and four downsampled data sets. The shaded area shows standard deviation (SD.) from the mean for all cells after QC filtering to remove cells with <500 unique transcripts. (C) The median number of unique transcripts (UMIs) per cell for each data set, shaded area shows SD (D) Number of differentially expressed (DE) genes identified between clusters shown in e, using MAST (Finak et al., 2015). (E) UMAP plots of each data set. Each data point is one cell coloured by cluster identified with the same parameters (resolution = 0.35). Colours are not transferred between plots. Mean reads per cell for each data set are indicated above in bold. The analysis was performed as described previously (Briggs et al., 2020).

