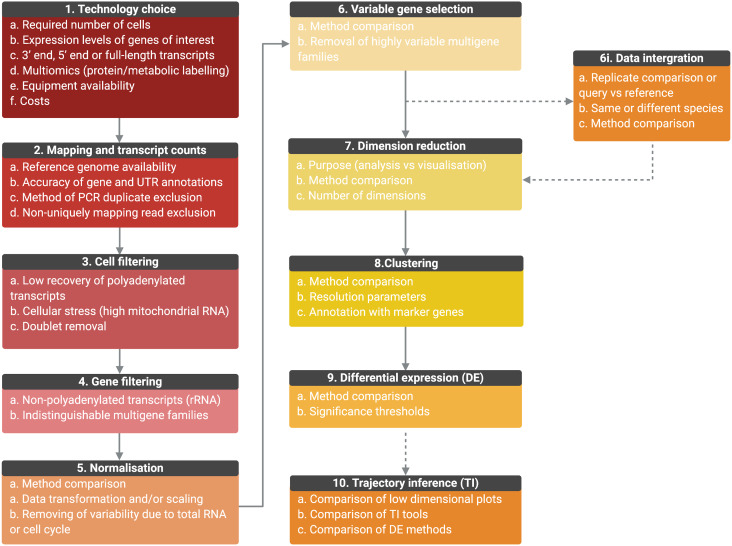
Fig. 4.
Outline of the general scRNA-seq analysis steps and user considerations. General analysis steps are indicate by numbers and points of consideration are listed below each. (1) The choice of technology will depend on the number of cells required, the expression level of genes, whether full-length transcripts are required, equipment availability and costs. Once scRNA-seq is performed, sequencing is mapped, and transcript counts per gene for each cell are calculated (2). Counts data will be affected by the accuracy of the genome, gene and UTR annotations, PCR duplicate removal and non-uniquely mapping reads. Data will then require filtering to remove cells of low quality or doublets (3) and genes for which transcript counts are likely to be inaccurate (4). Once filtered, data will require normalization, the best method for which will be data set-dependant (5). Data can also be scaled to remove variable gene expression due to total RNA per cell differences and cell cycle dependant gene expression variation. For further analysis, only the top variable genes should be selected to avoid introducing noise (6). Genes from multiple selection methods should be considered and some genes may require removal from variable gene lists, such as VSGs, if not under investigation. (6i) Replicate samples can be integrated, or query cells can be mapped to a control data set or cell ‘atlas’ of the same or different species. Methods should be compared and will depend on aims. As it is not possible to work in high-dimensional space, data should then be reduced (7) and the appropriate number of dimensions to include should be tested. The type of dimensional reduction performed will depend on aims (analysis or visualization) (8). Cells can be clustered by gene expression using reduced data and labelled by investigating the expression of marker genes. Cluster numbers will be dependent on parameters such as resolution. Differential expression (DE) analysis can be performed between clusters or between conditions if data is integrated (9). Tools are still under development to improve power and false discovery rates, and so methods should be compared. If investigating a biological progression between cellular states, trajectory inference (TI) can be performed (10). Over 70 tools exist and performance depends on the topology of the data in low-dimensional plots. Results should be compared and DE across trajectories investigated. (Created with BioRender.com)

