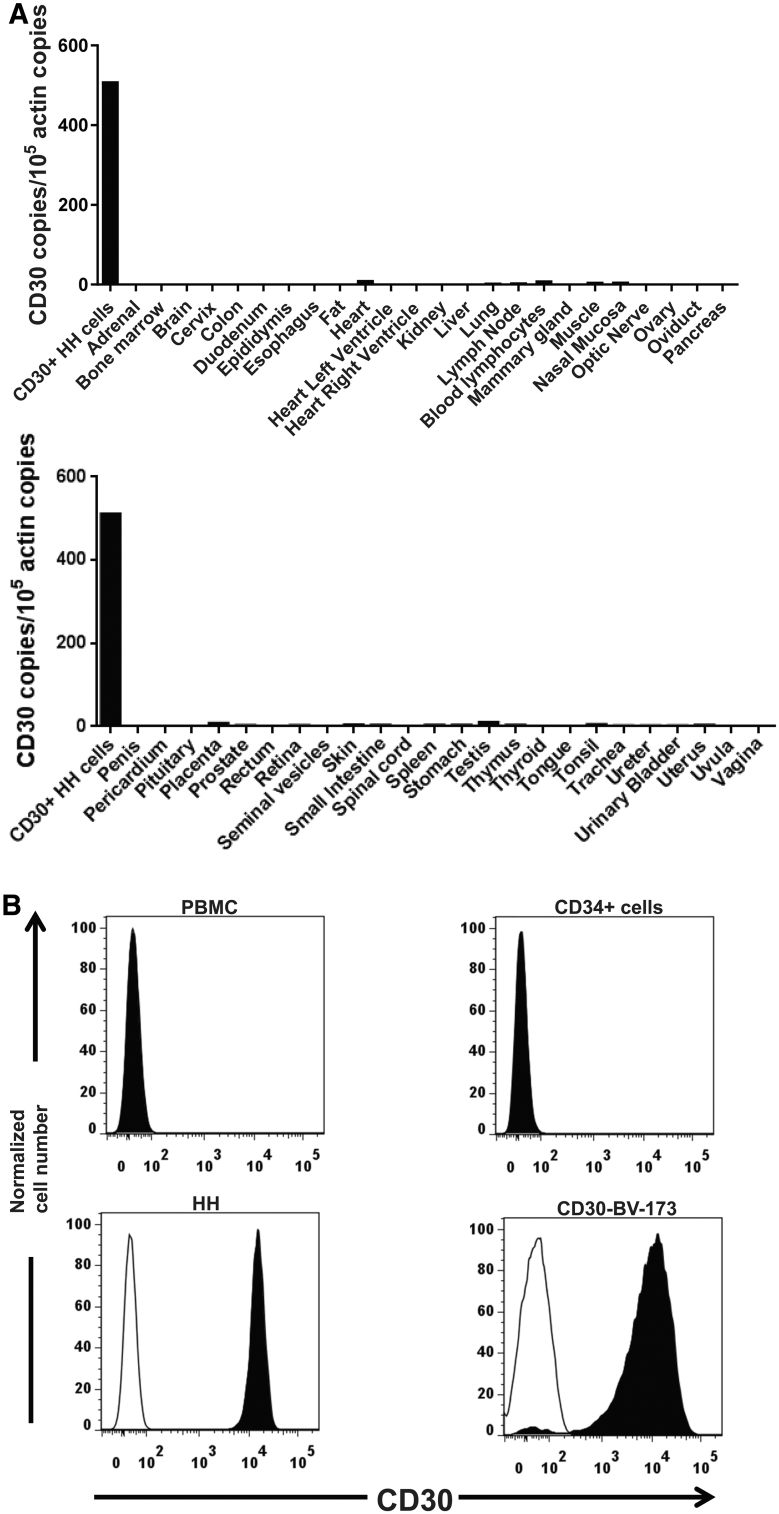
Figure 1.
Expression of CD30 in human tissues and cell lines. (A) CD30 RNA expression was assessed in all major normal tissues and the CD30+ lymphoma cell line HH. Quantitative PCR was performed on cDNA from each of the tissues. CD30 cDNA copies were normalized to actin cDNA copies from each tissue. (B) The indicated cell types were stained with an anti-CD30 antibody and an isotype control antibody. The plots show overlapped histograms for CD30 (solid black histograms) and isotype control antibody (open histograms). The PBMC histogram shows all PBMCs. The CD34+ plot is gated on flow-sorted CD34+ cells from peripheral blood of a patient treated with granulocyte colony-stimulating factor. Because of complete overlap between the anti-CD30 histogram and isotype histogram, the open isotype histograms are not visible for PBMCs and CD34+ cells. The HH and CD30-BV173 histograms show staining of all cells of the HH and CD30-BV173 cell lines. PBMC, peripheral blood mononuclear cell.

