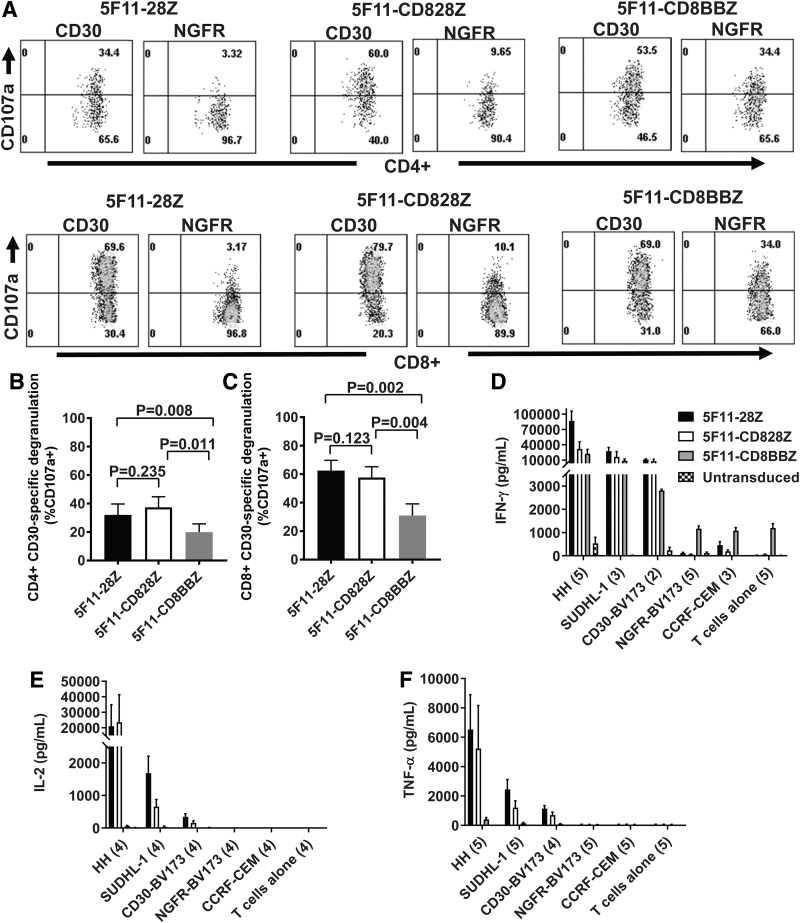
Figure 3.
Degranulation and cytokine release by anti-CD30 CAR T cells. (A) To perform degranulation assays, CAR-transduced T cells were incubated with either CD30-BV173 (CD30) target cells or NGFR-BV173 (NGFR) target cells for 4 h in the presence of an antibody against CD107a. After 4 h, cells were stained for CD3, CD4, and CD8 and analyzed by flow cytometry. Plots are gated on live CD3+ lymphocytes and then on either CD4+ or CD8+ cells. CD107a degranulation assays were performed as described in A for (B) CD4+ T cells and (C) CD8+ T cells. The mean + SEM of CD30-specific degranulation is shown for the indicated CARs. CD30-specific degranulation was calculated by subtracting the %CD107a+ events with NGFR-BV173 stimulation from the %CD107a+ events with CD30-BV173 stimulation. Statistical comparison was by paired two-tailed t-test; n = 5. Correction for multiple comparison was done by the Bonferroni method; p-values <0.017 were considered statistically significant. (D–F) ELISAs were performed on the culture supernatants after overnight culture of CAR T cells with target cells. (D) IFNγ ELISA: numbers of replicate experiments with T cells from different donors are given in parentheses on the x-axis with the exceptions that n = 4 for untransduced T cells+NGFR-BV173 and untransduced T cells alone. For the ELISA results in (D–F), bars represent mean + SEM. The legend with D indicates the T cell populations analyzed, and the legend applies to the ELISAs in (D–F). Statistical comparisons were made for (D–F) with the ratio two-tailed paired t-test with correction for multiple comparisons by the Bonferroni method; p < 0.0170 was considered statistically different. In (D–F), all statistically different comparisons of cytokine release by CAR T cells are listed below. Differences that were not statistically different are not listed. IFNγ release was statistically higher for 5F11-28Z versus 5F11-CD8BBZ for HH targets (p = 0.0008). Nonspecific IFNγ release against NGFR-BV173 targets was statistically lower for 5F11-28Z (p = 0.0005) and 5F11-CD828Z (p < 0.0001) versus 5F11-CD8BBZ. Nonspecific IFNγ release against NGFR-BV173 was also statistically lower for 5F11-828Z versus 5F11-28Z (p = 0.0152). (E) IL-2 ELISA: numbers of replicate experiments with T cells from different donors is given in parentheses on the x-axis, except n = 3 for the CD30-BV173 plus 5F11-CD8BBZ combination. IL-2 release was statistically higher for 5F11-28Z versus 5F11-CD8BBZ for HH (p = 0.0107) and CD30-BV173 (p = 0.0014). IL-2 release was statistically higher for 5F11-CD828Z versus 5F11-CD8BBZ for CD30-BV173 (p = 0.0003). IL-2 release by 5F11-CD8BBZ T cells was often too low to be easily seen on the graph. (F) TNFα ELISAs were performed on culture supernatants. The number of replicate experiments with T cells from different donors is given on the x-axis. TNFα release was statistically higher for 5F11-28Z versus 5F11-CD8BBZ for HH (p = 0.0008), SUDHL-1 (p = 0.0012), and CD30-BV173 (p = 0.0055). TNFα release was statistically higher for 5F11-CD828Z versus 5F11-CD8BBZ for HH (p = 0.0041) and CD30-BV173 (p = 0.0129). ELISA, enzyme-linked immunosorbent assay; IFNγ, interferon gamma; TNFα, tumor necrosis factor alpha.

