
FIG 2.
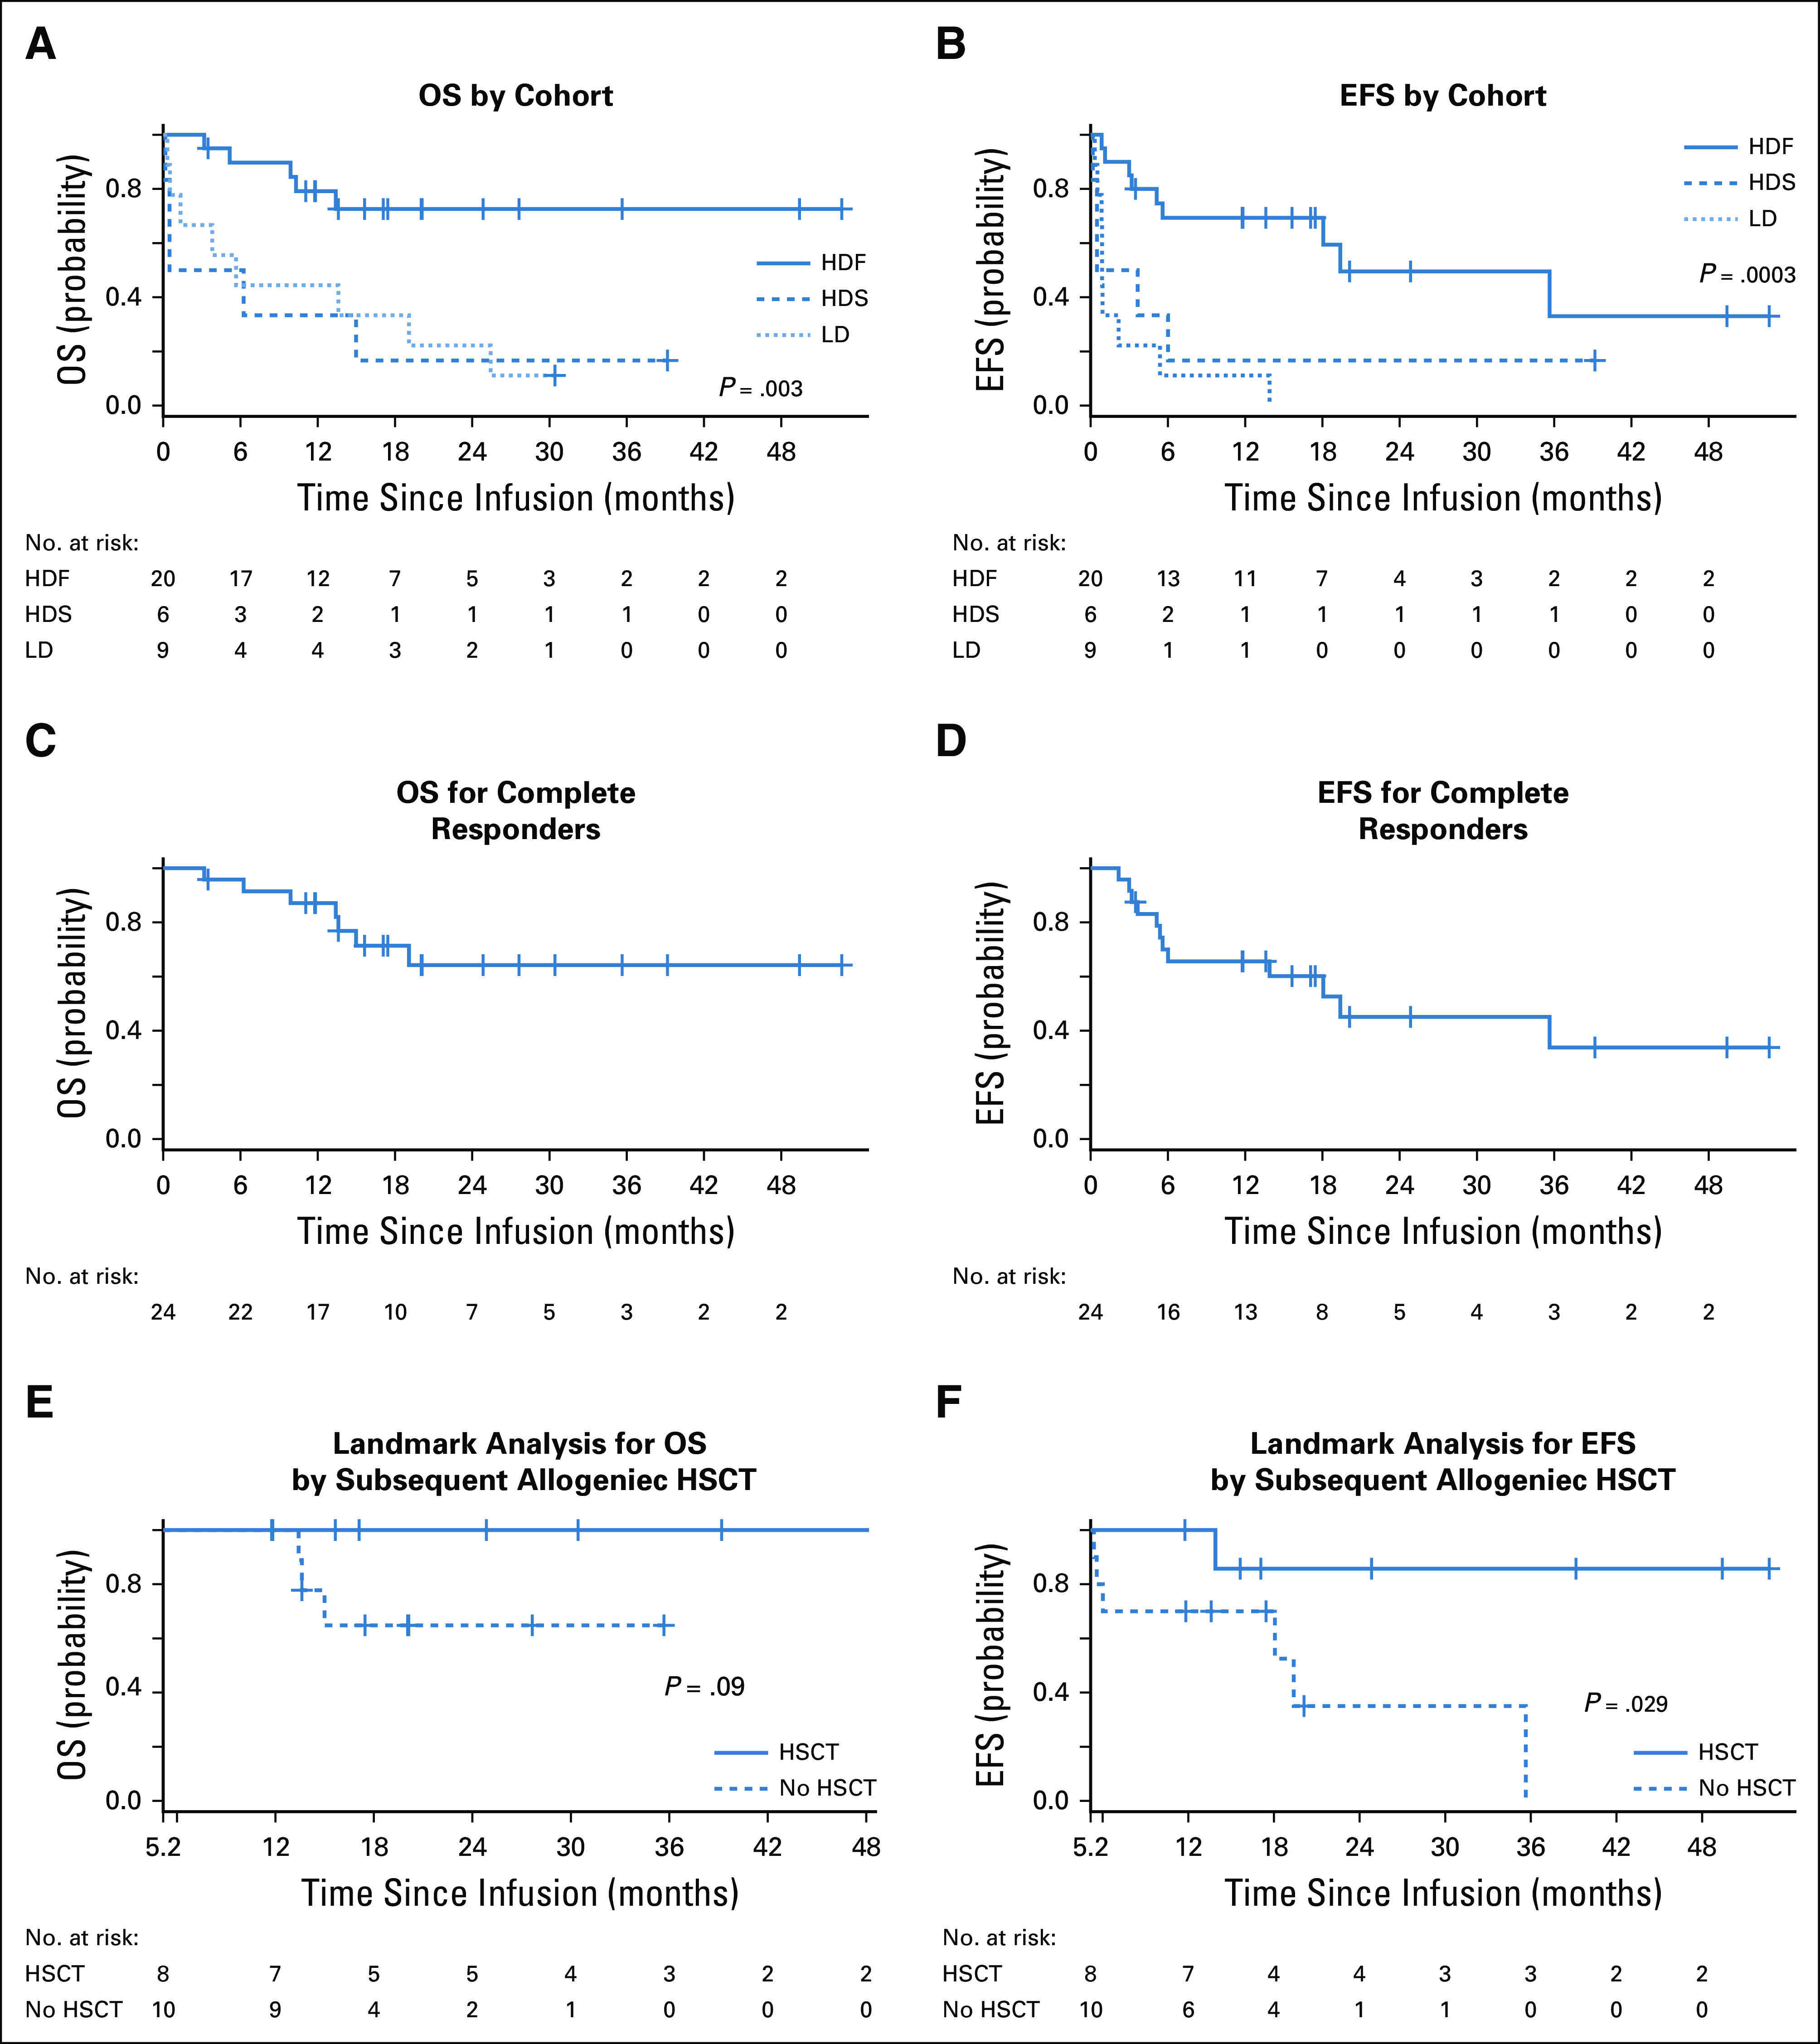
Kaplan-Meier graphs of overall survival (OS) and event-free survival (EFS). (A) OS by cohort. (B) EFS by cohort. (C) OS for complete responders. (D) EFS for complete responders. (E) Landmark analysis for OS by subsequent allogeneic hematopoietic stem-cell transplantation (HSCT). (F) Landmark analysis for EFS by subsequent allogeneic HSCT. HDF, high-dose fractionated; HDS, high-dose single infusion; LD, low dose.