
Fig. 1. Hypoxia leads to an increase in solitary neuroendocrine (NE) cell numbers in the adult mouse trachea.
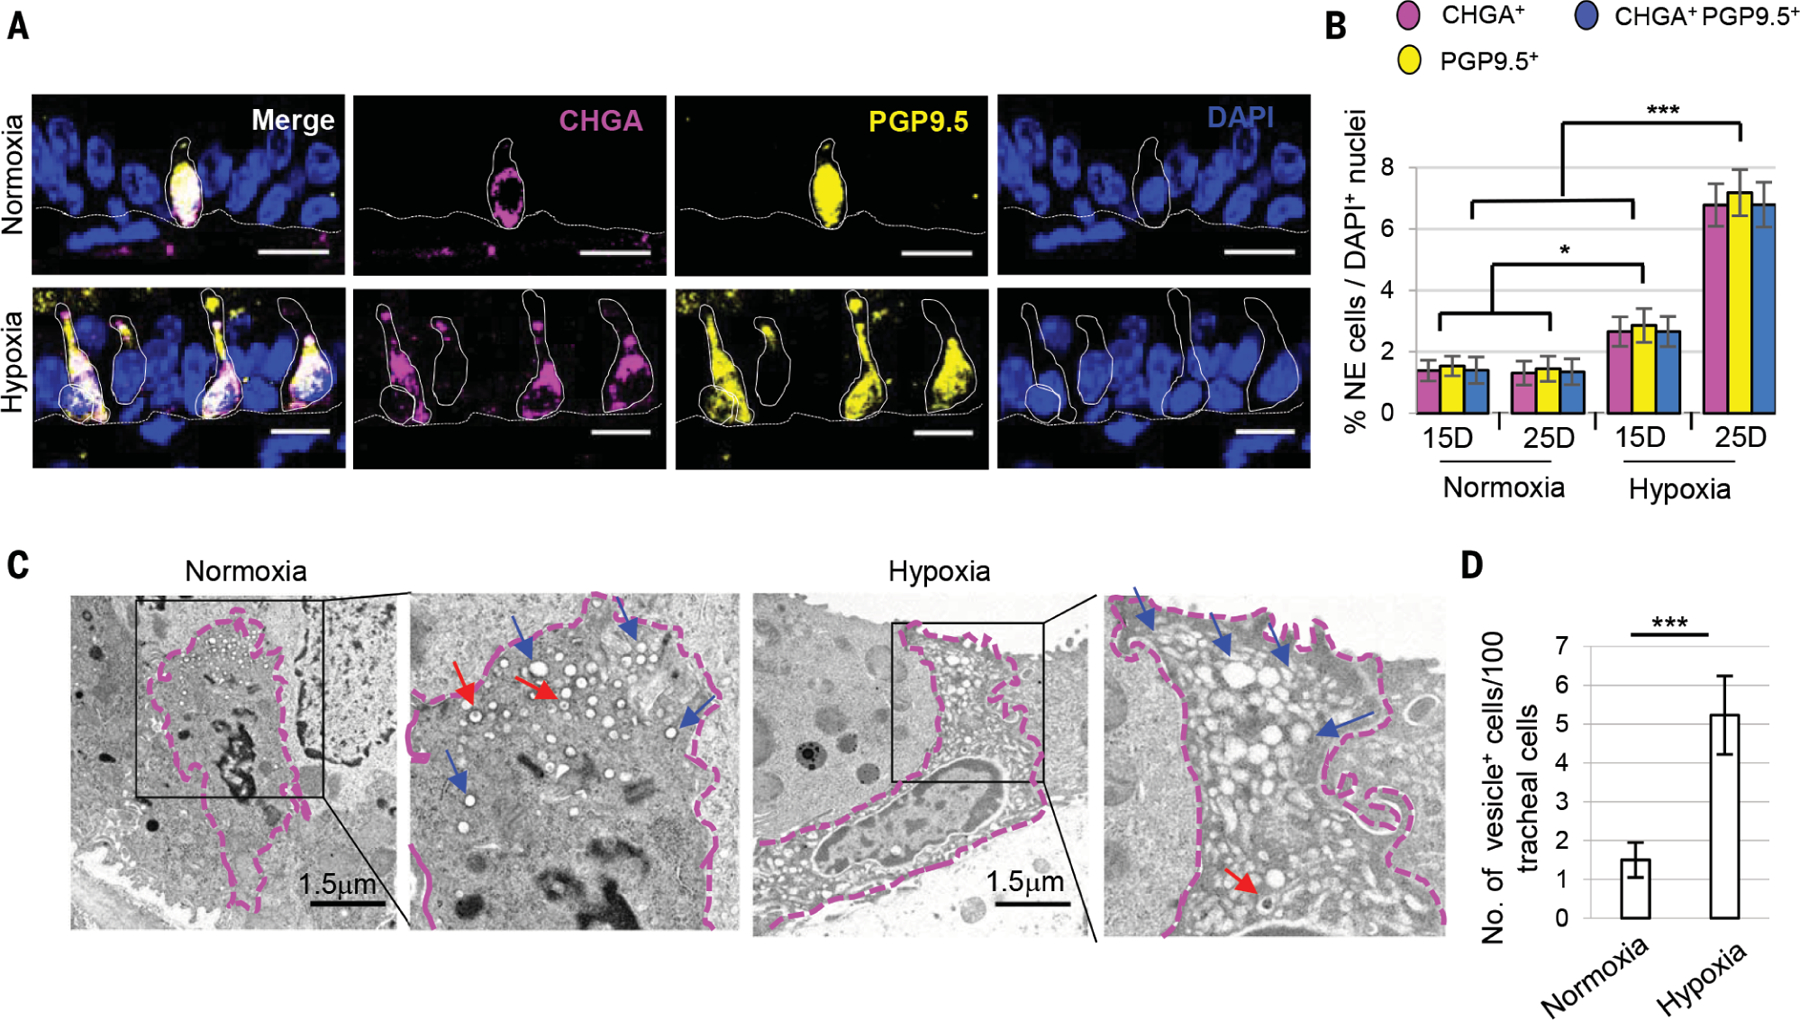
(A) Immunostaining for NE cell markers PGP9.5 (yellow) and CHGA (magenta). (B) Quantification of the percentage of CHGA+, PGP9.5+ and double-positive solitary NE cells in tracheal sections (n = 8). Dotted lines indicate basement membrane and cell borders. (C) Transmission electron microscopy (TEM) images of solitary NE cells and (D) quantification of cells with NE vesicles after 25 days of normoxia and hypoxia (n = 2) (total 300 nuclei from each condition). Blue arrows indicate empty core vesicles, and red arrows point to empty degranulating vesicles. Dotted magenta lines demarcate NE cell borders. n= biological replicates/condition repeated three times (three independent experiments excluding TEM experiments). ***p < 0.001, **p < 0.01, *p < 0.05; error bars, means ± SD. Scale bars, 20 μm (unless indicated otherwise).