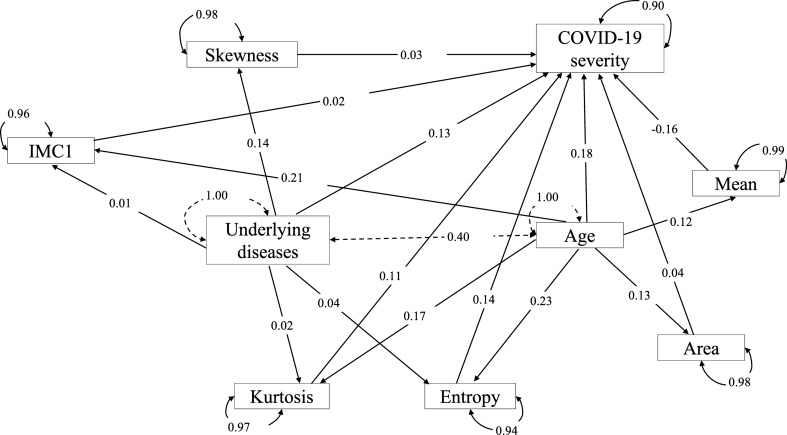
Fig. 6.
Path plot of the mediation analysis model with multiple mediators. The standardized effect estimates of each variable are shown on the edges of the paths. The mediators are Entropy, Kurtosis, Skewness, Mean, Area, and IMC1. Dependent variable is the COVID-19 severity, and independent variables are the Underlying disease and Age. Curves with arrowheads on both sides is the standardized residual variance. Solid curve is for dependent variable and mediators. Dash line curve is for independent variables. Straight dash line represents the standardized covariance of two independent variables. Straight solid line with arrowhead on one side is the standardized effect estimate

