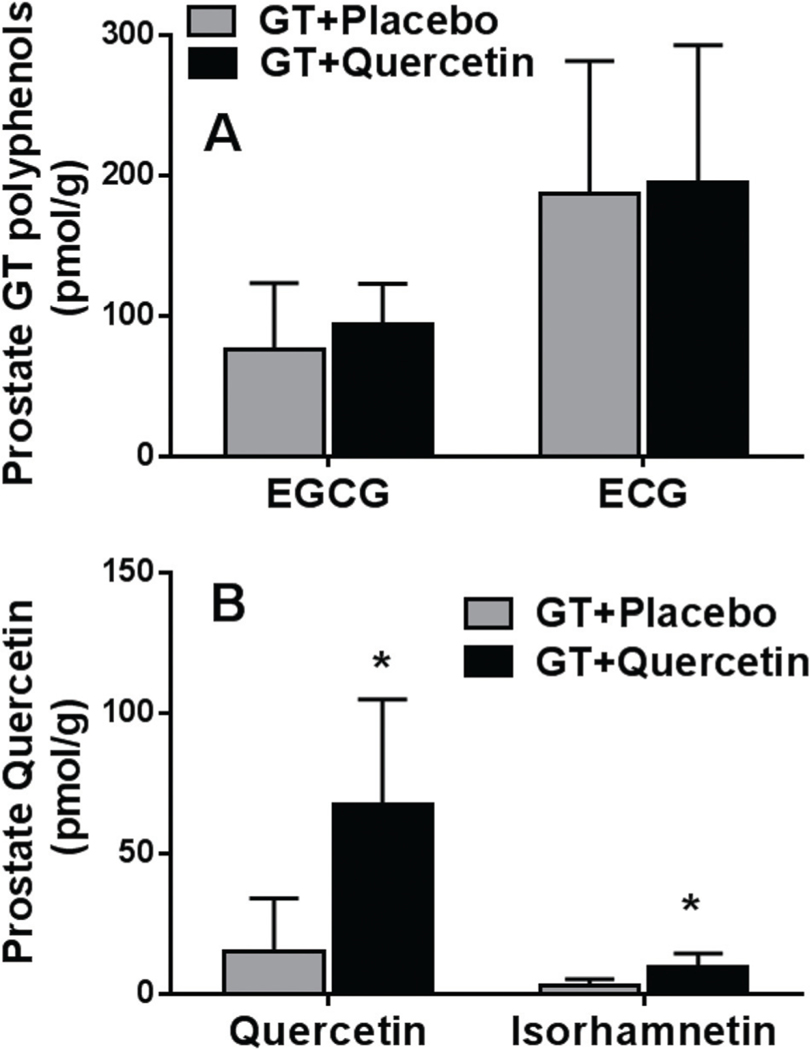
Fig. 1.
Prostate concentration of tea polyphenols (A) and quercetin/isorhamnetin (B) in prostate collected at time of surgery. Data are mean ± SD. *p-Value (<0.05) reflect comparison of GT + Q with GT + PL intervention. Number of participants: GT + PL = 16, GT + Q = 15. The concentration of EGC and EC was below the detection limit in the majority of prostate samples. We did not detect MeEGCG and MeEGC in the prostate.

