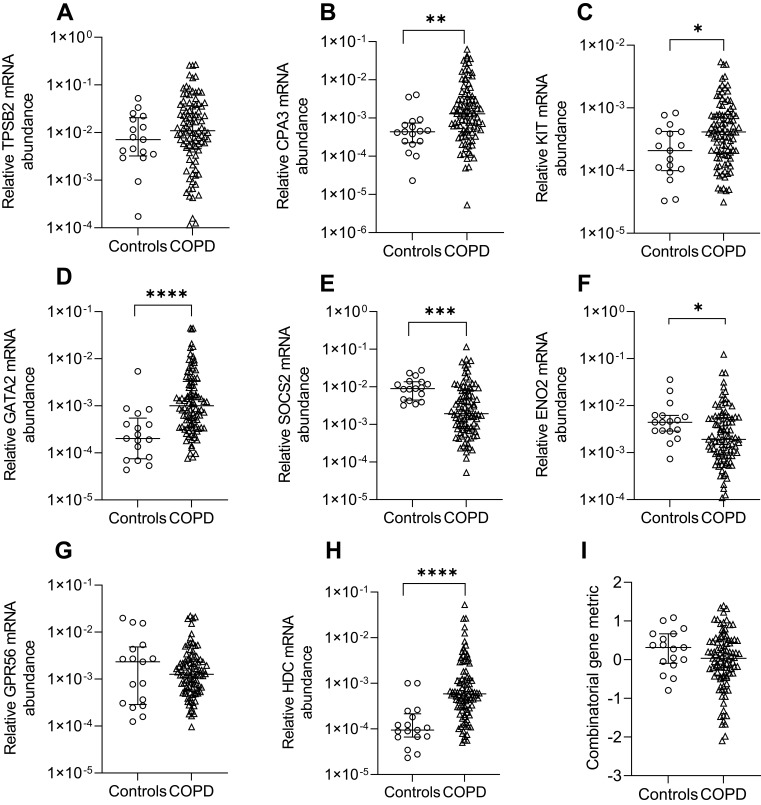
Figure 1.
Relative mRNA abundance of (A) TPSB2, (B) CPA3, (C) KIT, (D) GATA2, (E) SOCS2, (F) ENO2, (G) GPR56, (H) HDC, and (I) combinatorial MC/basophil gene metric in COPD participants compared to control participants. Bars represent median, with error bars representing Q1, Q3. Relative mRNA abundance compared between groups are expressed as 2−ΔCt relative to the housekeeping gene β-actin. Combinatorial gene metric based on ΔCt gene expression values. *p≤0.05, **p≤0.01, ***p≤0.001, ****p≤0.0001.

