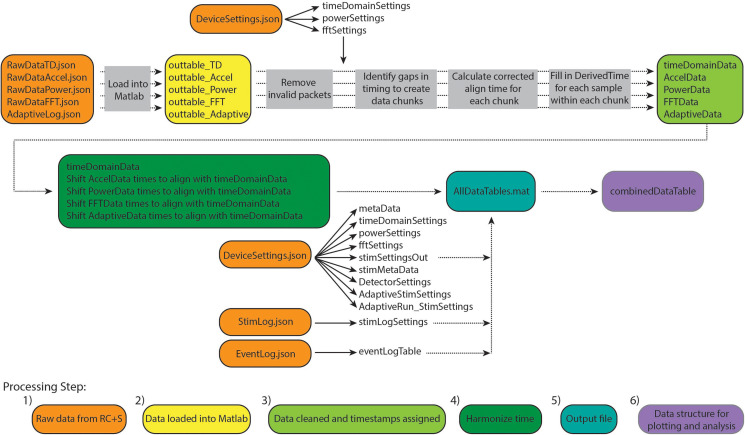
FIGURE 2.
Overview of Summit RC+S data parsing and time alignment. Raw JSON files (orange) are loaded into Matlab (yellow). For each time series data stream, packets with invalid data are removed and timing variables are used to calculate DerivedTime for each sample (light green). Samples in each data stream are aligned to DerivedTime for time domain data, which has the highest sampling rate (dark green). These data tables are saved in a.mat file (using a combination of tables and sparse matrices) along with tables containing settings information and metadata (blue). Finally, combinedDataTable is created which can be used for plotting and user-specific analyses (purple).

