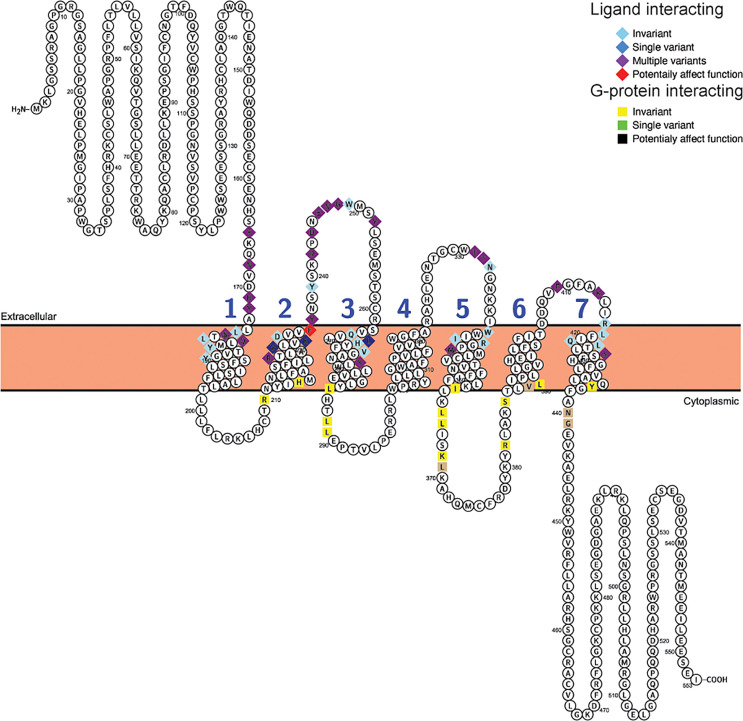
Figure 5.
Variability in ligand and G-protein interacting sites in mammalian GLP-2 receptors (Glp2r). Snake plot of the Gcgr protein sequences (Uniprot accession: GLP2R_HUMAN) generated with Protter (wlab.ethz.ch/protter/start/) (71). Extracellular regions are shown at the top, cytoplasmic regions at the bottom, and transmembrane domains between the two lines. Transmembrane domains are extracted from the Uniprot accession files for the proteins by Protter. The transmembrane domains are numbered (1-7). Ligand interacting residues are shown as diamonds and G-protein interacting sites as squares. Variability in the ligand and G-protein interacting residues in the sequences from 78 mammalian species are displayed in different colors with light blue diamonds and yellow squares being invariant, dark blue diamonds only have one species varying, purple diamonds and tan squares representing sites that either vary in multiple species and/or have multiple amino acid states, while red diamonds identify sites that have a substitution that was predicted to “Affect function” by SIFT (67) and be “Deleterious” by PROVEAN (68).

