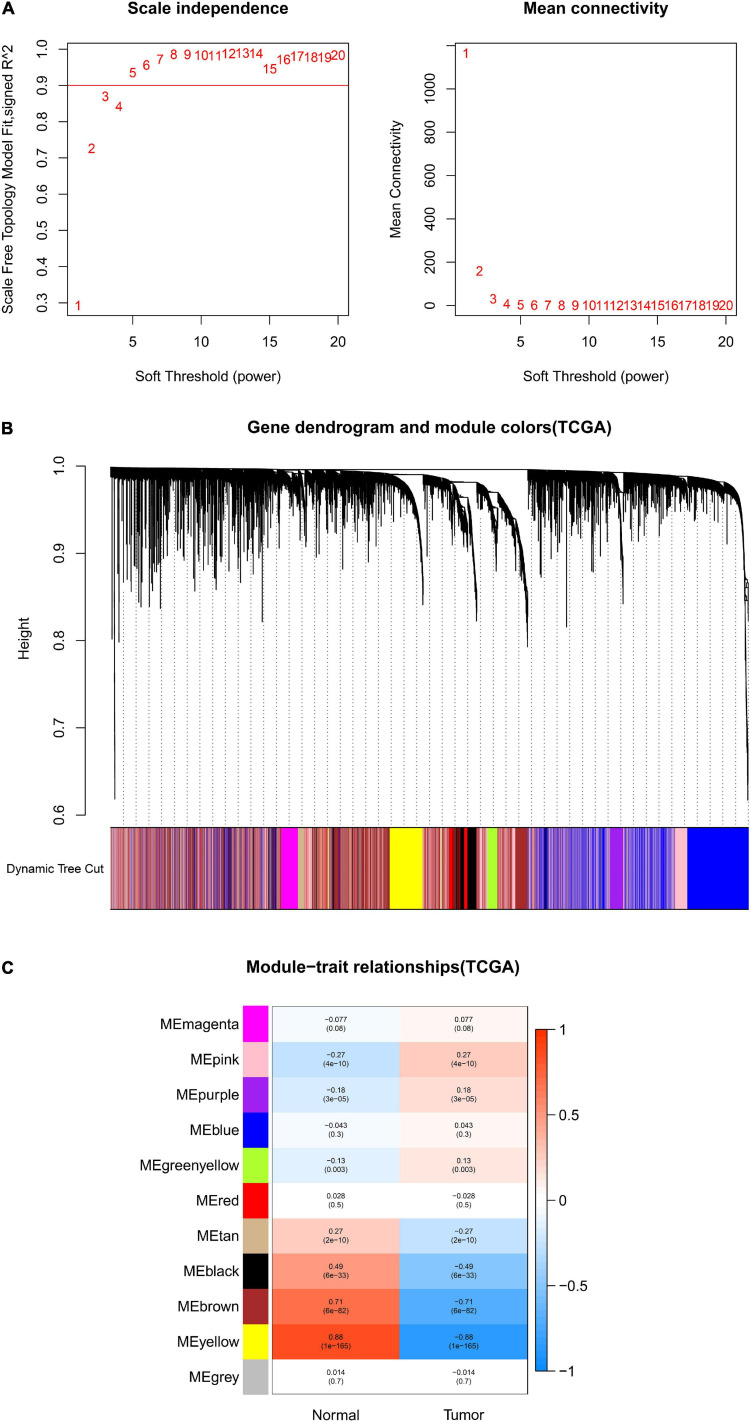
FIGURE 2.
Identification of modules associated with clinical information in the TCGA-COAD dataset. (A) Determination of soft-thresholding power in WGCNA analysis. (B) Gene cluster tree. Based on the adjacency-based dissimilarity of the hierarchical clustering gene clustering chart, dynamic tree cutting method was utilized to identify modules by dividing the tree diagram at significant branch points. Modules are assigned different colors in the horizontal bar immediately below the tree diagram. (C) Module-trait relationships for normal and tumor. Each row in the table corresponds to a color module, and each column to a clinical trait. Numbers in each cell reported the correlation coefficient between each module and clinical traits and the corresponding p-value.

