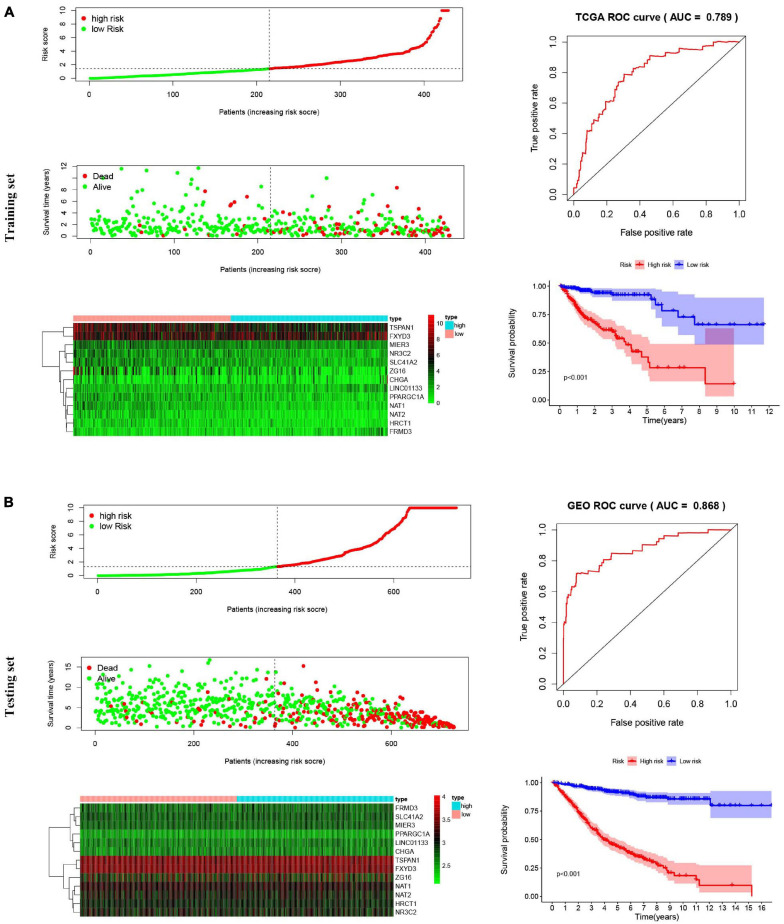
FIGURE 7.
Risk score analysis, Kaplan–Meier survival curves and ROC curves for the 13-gene signature in COAD. Our study employed TCGA-COAD cohort as the training dataset and an independent cohort by merging the GES39582 and GSE17536 datasets as the testing dataset. (A) The distributions of the risk score, survival status and expression profiles, Kaplan–Meier curve and ROC curve of the 13-gene signature in the training set. (B) The distributions of the risk score, survival status and expression profiles, Kaplan–Meier curve and ROC curve of the 13-gene signature in the testing set.

