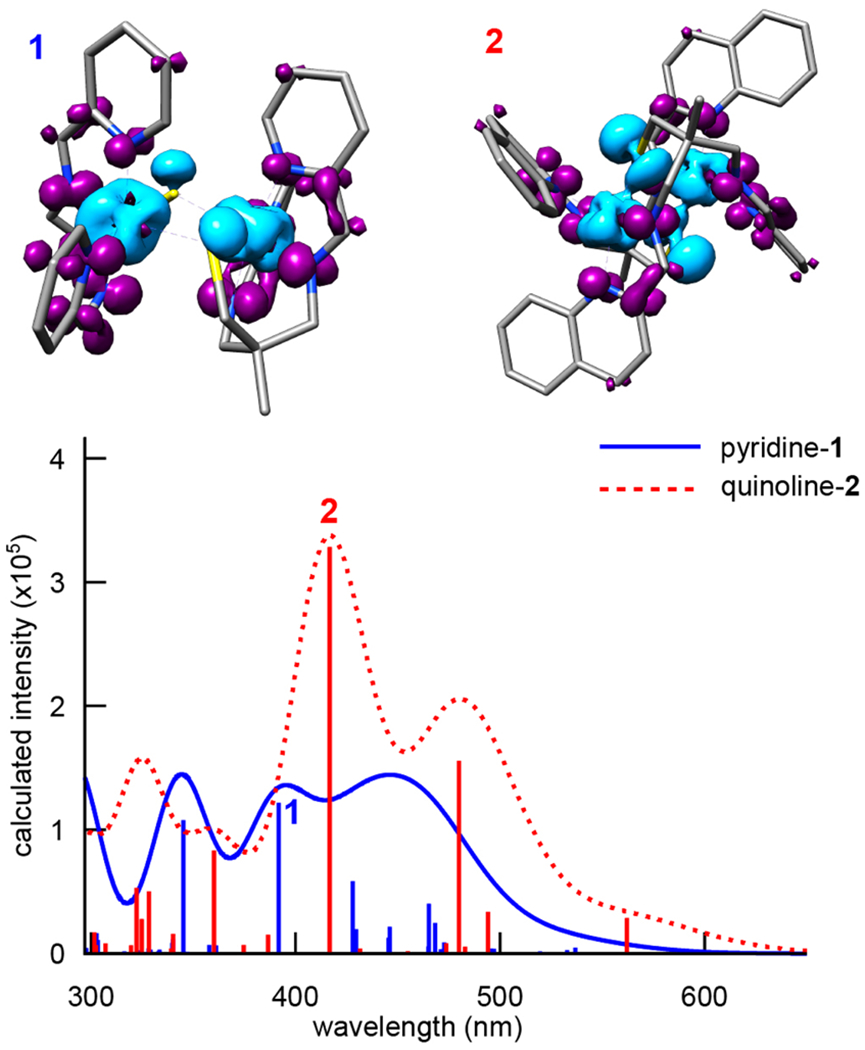
Figure 11.

TD-DFT-calculated electronic absorption spectra of 1 and 2. Transition difference densities for the most intense transitions are shown at an isovalue of 0.0015 a0−3, with areas of decreased electron density (donors) shown in teal and increased electron density (acceptors) shown in purple.
