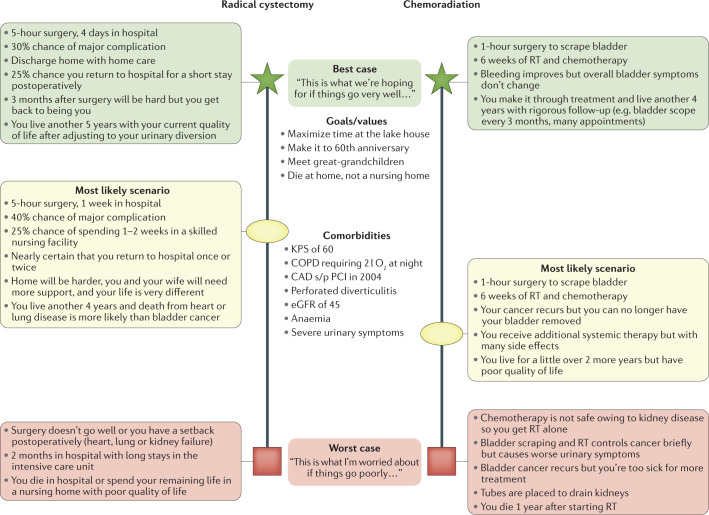
Fig. 3. Best case/worst case.
This communication tool is a useful graphical aid that the surgeon can use, particularly when discussing treatment options with patients who are acutely ill or have multiple comorbidities. Use of this framework was first described by Schwarze. “To start, the surgeon names each of the patient’s treatment options and describes … the ‘best case’ outcome, the ‘worst case’ outcome, and what [they believe] is the ‘most likely’ outcome for each treatment. The verbal description of each ‘case’ incorporates rich narrative derived from clinical experience and relevant evidence, and focuses on the story of how the patient might experience an outcome, instead of quoting discrete statistical risks. The surgeon simultaneously draws the pen-and-paper diagram, and under each treatment option […] places a vertical bar. The bar length suggests a range of outcomes and the relative magnitude of difference between the ‘best case’ (star), the ‘worst case’ (box) and the physician’s estimate of the ‘most likely’ outcome (oval). After presenting the tool, the surgeon uses phrases to encourage deliberation such as, ‘what do you think about all of this?’”116. CAD, coronary artery disease; COPD, chronic obstructive pulmonary disease; eGFR, estimated glomerular filtration rate (ml/min/1.73 m2); KPS, Karnofsky performance status; PCI, percutaneous coronary intervention; RT, radiotherapy.

