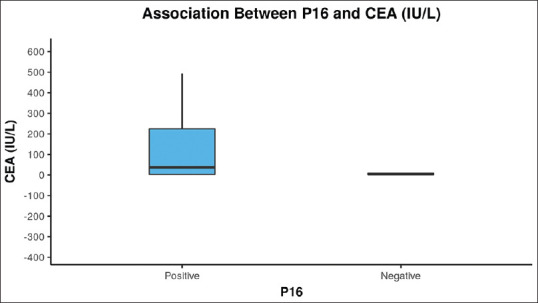
Figure 2.

The Box-and-Whisker plot below depicts the distribution of carcinoembryonic antigen (IU/L) with p16. The middle horizontal line represents the median carcinoembryonic antigen (IU/L), the upper and lower bounds of the box represent the 75th and the 25th centile of carcinoembryonic antigen (IU/L), respectively
