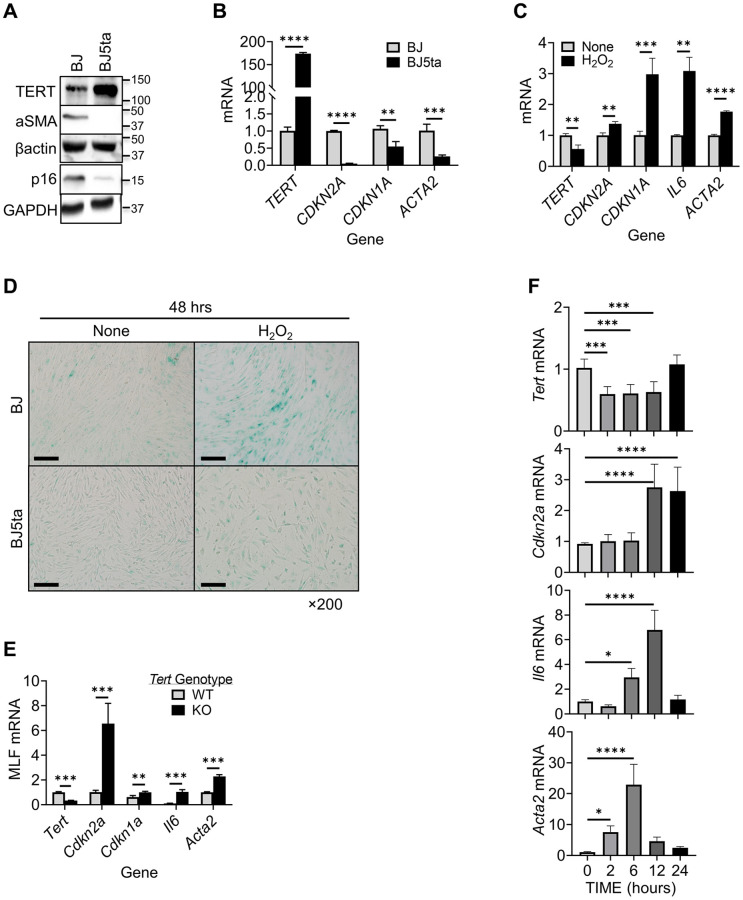
Figure 1.
TERT expression was negatively correlated with αSMA and p16 expression in fibroblasts. (A) Cell lysates were analyzed for TERT, αSMA and p16 proteins by Western blotting. Representative blots from 3 separate experiments are shown. (B) RNA samples were analyzed for TERT, CDKN2A, CDKN1A and ACTA2 mRNAs by qPCR and expressed as 2−ΔΔCT. The fold change relative to BJ cells is shown for each gene. (C) BJ cell RNA was collected after 6 hours of treatment with H2O2, and analyzed for TERT, CDKN1A, CDKN2A, IL6, and ACTA2 by qPCR. (D) Cellular senescence was examined by SA-β-gal staining in cultured cells. A representative image set is shown. Scale bars: 100 μm. (E) MLF RNA was analyzed for Tert, Cdkn2a, Cdkn1a, Il6 and Acta2 by qPCR. (F) Primary cultured MLFs were treated with BLM for indicated hours and then analyzed for Tert, Cdkn2a, Il6, and Acta2 by qPCR. N = 3–4 in (B) and (C), N = 3–5 in (E) N = 6 in (F). *P < 0.05. **P < 0.01. ***P < 0.001. ****P < 0.0001.

