
Figure 3.
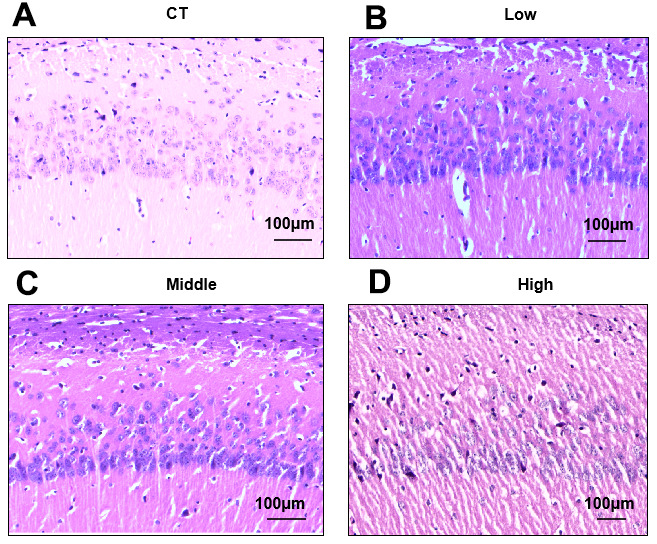
Effects of STX exposure on the pyramidal cells and neuronal cells in the CA1 area of the hippocampus. (A–D) Representative photomicrographs of Hematoxylin-Eosin (HE) staining of brain sections (n = 6 for each group) from CT, Low, Middle and High group. Magnification, 100×. Scale bar, 100 μm.